Policy Briefs | 23 March, 2026
The EU’s CBAM and Gulf Countries: An Analysis of Early Evidence
On 1 January 2026, imports of certain carbon-intensive goods into the European Union (EU) became subject to additional charges under the Carbon Border Adjustment Mechanism (CBAM). This brief evaluates the impacts of this mechanism on Gulf Cooperation Council (GCC) countries—Bahrain, Kuwait, Oman, Qatar, Saudi Arabia, and the United Arab Emirates (UAE). Aluminium is the main impact channel for GCC countries, with exposure varying across GCC members. Bahrain and the UAE are the most affected, both in absolute terms and relative to GDP. Saudi Arabia and Oman face more limited exposure, while Kuwait and Qatar are largely unaffected. Under current CBAM rules, which consider only direct emissions for aluminium, the carbon intensities for primary aluminium made by GCC producers are similar to the EU and lower than key competitors China and India. There is, therefore, scope for GCC producers to offset demand decreases by increasing their market share. Future outcomes will depend on indirect emissions coverage, EU compensation reforms, anti-resource shuffling measures, and GCC decarbonisation initiatives.
Attribution: Niven Winchester, “The EU’s CBAM and Gulf Countries: An Analysis of Early Evidence,” ORF Issue Brief No. 864, Observer Research Foundation, March 2026.
Introduction
Since the European Union Emissions Trading System (EU ETS) became operational in 2005, carbon leakage—the increases in emissions elsewhere due to the offshoring of emissions via imports—has been a concern for policymakers. Historically, the EU has addressed leakage concerns by providing support for energy-intensive, trade-exposed industries via free allocation of EU Allowances (EUAs) and a national indirect cost compensation system.
The free allocation system uses product-specific benchmark emissions values, expressed in tonnes of carbon dioxide (CO2) per unit of product. The amount of free allocation for each firm depends on its recent output and the benchmark emission values for the product it produces. The national indirect cost compensation system allows member states to provide funds to certain installations to compensate them for increases in electricity costs due to the EU ETS.
In 2023, the EU established the Carbon Border Adjustment Mechanism (CBAM) as a new tool to combat emissions leakage.[1] The CBAM applies carbon charges to imports of emissions-intensive goods while phasing out free allocations for EU producers. The mechanism was implemented in two phases. In the transitional phase, which lasted from 1 October 2023 to 31 December 2025, importers were required to report emissions, but no charges were applicable. In the definitive phase, which started on 1 January 2026, financial obligations for importers will be rolled out over a nine-year period.
A large body of academic studies has evaluated border carbon measures like the CBAM. Modelling studies generally find that leakage rates under unilateral climate policy are positive but modest, and that carefully designed border carbon levies can reduce them.[2],[3],[4] The welfare effects of border carbon measures, however, are mixed. Domestic producers often benefit from improved competitiveness, while consumers face higher prices. Macro models frequently show that though border carbon measures can reduce leakage, this is at a cost to welfare in both the imposing and targeted countries. Internationally, border carbon adjustments may disproportionately burden developing countries.[5] Some studies conclude that the CBAM may be a catalysis for the adoption of carbon prices in other jurisdictions.[6]
The CBAM Framework: An Overview
The CBAM specifies a phase-in of carbon charges on imports and a phase-out of domestic support. Carbon levies will apply to EU imports from all third countries, except those closely integrated with the EU’s carbon market (Iceland, Liechtenstein, Norway and Switzerland).[a] Under the system, importers of certain emission-intensive goods must purchase and surrender CBAM certificates related to the greenhouse gas (GHG) emissions embedded in those goods. The price of CBAM certificates is linked to the price of EUAs. If an exporter incurs a carbon cost in their home country, they can offset this against their CBAM obligation, which prevents emissions being charged twice. As EU producers are required to surrender EUAs for their emissions, the mechanism is intended to align EU and imported carbon costs.
Embedded emissions that count towards the CBAM include direct emissions (scope 1) and, for some products, indirect GHG emissions (scope 2). Direct emissions are gases released during the production process, such as on-site fuel combustion. Indirect emissions are GHGs from electricity generation for the production process. Emissions from the production of some input materials that are themselves included in the CBAM (known as precursors) are also included in the calculation of embedded emissions. Embedded emissions calculations are based on plant-level data or, if unavailable, European Commission default values.[7]
CBAM-covered goods include cement, iron and steel, aluminium, fertilisers, electricity, and inorganic chemicals (hydrogen, ammonia and derivatives). In the definitive phase, CBAM obligations for cement and fertilisers include both direct and indirect emissions. Other covered goods are only required to surrender CBAM certificates for direct emissions (and precursors, if applicable).
Coinciding with obligations for importers, free allocations for CBAM-covered products produced in the EU will be phased out by 2034 using a ‘CBAM factor’, which prescribes the proportion of free allowances received. The CBAM factor will fall sharply over the next eight years. Producers will receive 97.5 percent of the free allocation in 2026, 95.0 percent in 2027, 51.5 percent in 2030, 14.0 percent in 2033, and 0 percent in 2034.[8]
A key requirement for the mechanism to comply with World Trade Organization (WTO) rules is that imported goods face carbon costs comparable to those levied on EU producers. Accordingly, the CBAM factor is also to be used to adjust how much of the emissions embedded in imported goods are subject to the CBAM. The formula for each product is: Emissions subject to the CBAM = Embedded emissions – [EU benchmark] × [CBAM factor].[9]
If emissions embodied in an imported good equal the EU benchmark for that product, 2.5 percent of the embedded emissions will be subject to the CBAM in 2026. This CBAM obligation will rise as the CBAM factor falls, and is 2.5 percent in 2026, 5 percent in 2027, 48.5 percent in 2030, 86 percent in 2033, and 100 percent from 2034. The progressive rollout of the CBAM, the CBAM factor and the CBAM obligation (the percent of emissions embedded in imports subject to charges) is shown in Figure 1.
Figure 1: CBAM Factors and CBAM Obligations (%)
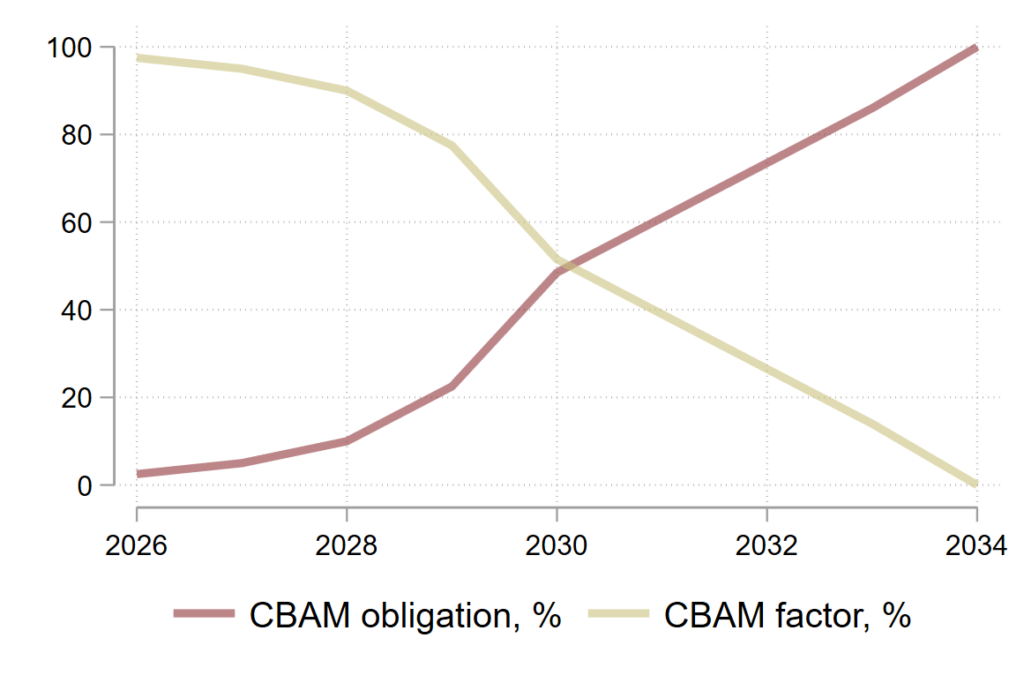
Source: European Union, “Regulation (EU) 2023/956”.[10]
In terms of indirect emissions, products for which indirect emissions are currently included in CBAM obligations (cement and fertilisers) are not included in indirect cost compensation systems. In the future, the CBAM may be extended to indirect emissions for more sectors.[11] Scholars have argued that if indirect emissions are more broadly included in the CBAM, the EU’s national indirect cost compensation payments should be reduced.[12] If indirect emissions are included for these sectors, reducing these compensation payments will likely be necessary to comply with WTO rules and avoid perceptions of unfairness. Failure to adjust compensations alongside the inclusion of indirect emissions in CBAM could undermine international climate cooperation and affect negotiation dynamics.
In December 2025, the EU released proposals to strengthen the efficacy of the CBAM, including expanding its scope to cover specific steel- and aluminium-intensive products and introduce additional anti-circumvention measures (e.g., by classifying pre-consumer scrap metal, such as aluminium offcuts, as a CBAM precursor).[13]
Impacts on Producers
As the CBAM specifies charges, it will impact producers both within and outside the EU through two channels. First, decreased support for EU producers and levies on imports will increase the prices that consumers pay for CBAM-covered goods, which will decrease EU demand for these products.
Second, as decreases in EU support and carbon charges depend on emission intensities, demand will shift from emission-intensive sources to less emission-intensive sources. This effect, ceteris paribus, will decrease demand for commodities produced by more emission-intensive producers and increase it for goods produced by less emission-intensive producers.
Considering both effects, demand for goods produced by firms with relatively high emission intensities will fall. Producers with relatively low emission intensities, however, could experience an increase in the demand for their products if the increase in their market share is sufficiently large.
Gulf Countries’ Exposure to CBAM
In 2023, the most recent year for which consistent data is available, the UAE exported US$2.7 billion worth of goods covered by the CBAM, more than any other GCC country. Bahrain had the next largest value of covered exports (US$1.3 billion), followed by Saudi Arabia (US$565 million), and Oman (US$400 million). Exports of CBAM-covered goods from both Kuwait and Qatar were less than US$1 million.[b]
Figure 2: GCC Exports of CBAM-Covered Goods to the EU (2023, US$ million)
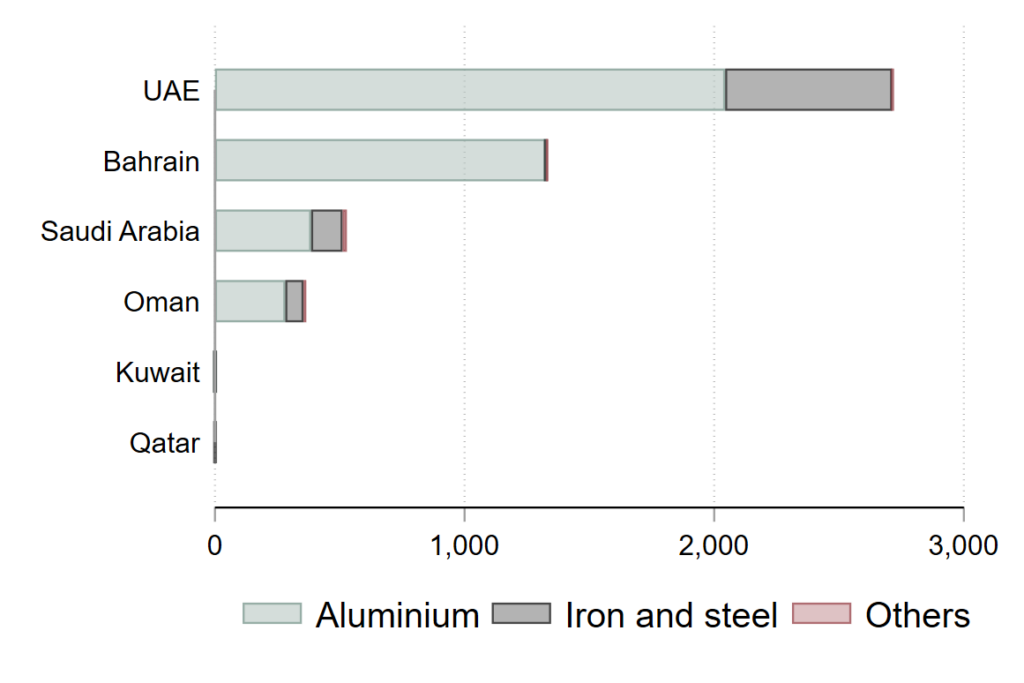
Source: Author’s calculations based on data from the World Bank[14] and United Nations.[15]
Note: Other products include cement, fertilisers, and inorganic chemicals.
Accounting for economic size, the value of CBAM-covered exports from Bahrain was 2.89 percent of its Gross Domestic Product (GDP). The UAE (0.53 percent), Oman (0.38 percent), and Saudi Arabia (0.05 percent) had the next highest covered export values as a proportion of GDP. Corresponding values for Kuwait and Qatar were less than 0.0005 percent.[c]
The exposure of GCC countries is driven by aluminium exports. This commodity accounts for 99.2 percent of Bahrain’s exports of in-scope goods, and between 68.1 percent and 75.3 percent of covered exports from the UAE, Oman, and Saudi Arabia. The importance of aluminium for GCC countries is reiterated by global production rankings. Although global aluminium production is dominated by China—which accounted for 59 percent of world production in 2024—the UAE is the world’s seventh-largest producer of aluminium, Bahrain the ninth, and Saudi Arabia the thirteenth.[d],[16]
Aluminium and CBAM
Aluminium products covered by the CBAM include unwrought aluminium (aluminium in a basic form that has not been processed into finished products), bars, sheets, plates, foil, tubes/pipes, certain fitted tubes, and articles of aluminium. For covered aluminium products, the embedded emissions factored into CBAM calculations include direct emissions and precursor emissions from unwrought aluminium, if it is used as an input.[17] As noted above, indirect emissions from electricity used in the production of aluminium are not currently included.
Aluminium Production
Unwrought aluminium can be produced by primary and secondary routes. Production via the primary route involves mining bauxite, refining it into alumina (also known as aluminium oxide), and then smelting it using carbon anodes (blocks of carbon) and electrolysis to get aluminium. For CBAM purposes, direct emissions from primary aluminium production include CO2 emissions from the consumption of carbon anodes and perfluorocarbons released during the smelting process (‘anode effects’). Emissions from the production of alumina and carbon anodes are not currently included in embedded emissions calculations, as they are considered raw materials.[18] Indirect emissions for primary aluminium can account for up to 80 percent of total emissions,[19] as aluminium smelting requires large amounts of electricity. But, as noted above, they are not currently included in the CBAM.
In the secondary route, aluminium is made by melting and refining scrap aluminium. In CBAM calculations, direct emissions from secondary aluminium arise from fuels used in scrap preparation and processing and precursor emissions from inputs of any unwrought aluminium.[20]
Although the CO2 intensity of secondary aluminium is significantly lower than that of primary aluminium, limited scrap supply means that primary aluminium is needed to meet global demand. In 2024, for instance, primary aluminium accounted for 66 percent of global production and secondary aluminium 34 percent.[21] The shares of secondary aluminium in total production in Bahrain (4 percent), Saudi Arabia (9 percent) and the UAE (3 percent) are significantly lower than those in the EU27 (84 percent), China (20 percent) and India (30 percent).[22] Consequently, this brief focuses on the impact of the CBAM on producers of primary aluminium.
The impact of the CBAM on GCC producers will depend on the CO2 intensity of their aluminium production relative to their competitors. A 2025 study by Hasanbeigi and Springer estimates the CO2 intensity of aluminium production in major producing countries/regions.[23] Using these estimates, this brief calculates the ‘CBAM CO2 intensity’ of primary aluminium production, where CBAM CO2 intensity is the amount of CBAM-covered emissions, measured in tonnes of carbon dioxide equivalent (CO2e) per tonne of aluminium (t Al).[e]
As per these calculations, the CBAM CO2 intensities of primary aluminium in Bahrain, the UAE, and Saudi Arabia are estimated to be between 1.60–1.65 tCO2e/t Al.[f] The CBAM CO2 intensities for GCC countries are similar to that for the EU27 (1.65), lower than those for China (2.28) and India (1.75), but slightly higher than those for Norway (1.53) and Iceland (1.59).
These estimates indicate that, in the EU market, the CBAM will increase the price of aluminium from GCC countries (due to border charges) and the EU (due to reduced free allocations) by about the same amount and will increase the cost of aluminium from China and India by a relatively larger amount. The CBAM will give a price advantage to aluminium from Norway and Iceland, but as these nations account for a relatively small share of global production and nearly all their aluminium production is already exported to the EU, this will have a minor market impact. Overall, there is scope for GCC aluminium producers to increase their EU market share, though this may not be enough to offset the CBAM-induced decrease in EU demand for aluminium.
This brief also calculates illustrative CBAM levies for select countries/regions by combining CBAM CO2 intensities with EUA projections by the Dutch bank ABN AMRO.[24] Forecasts indicate EUA prices will rise steadily, from 93 euro (US$109) in 2026 to 188 euro (US$220) in 2034 (Figure 3). Concurrently, CBAM charges for GCC countries will rise from US$4/t Al in 2026 to nearly US$350 in 2034. Assuming an aluminium price of US$2750/t Al, these levies will equate to ad valorem charges of 0.2 percent in 2026 and 12.7 percent in 2034. These figures indicate that the initial impacts of the CBAM will be relatively small but will increase sharply over time.
Figure 3: Illustrative CBAM Charges, US$/t Al
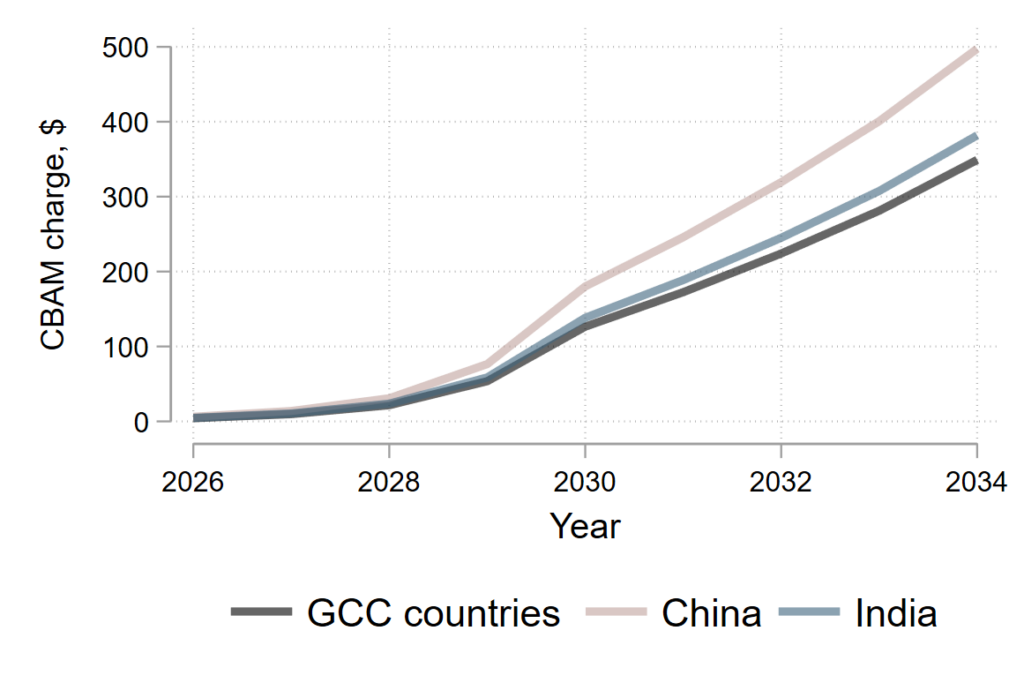
Source: Author’s calculations, based on Hasanbeigi and Springer’s calculation of CO2 intensities of aluminium production[25] and projected EUA prices from ABN AMRO.[26]
The estimates above are intended to provide order-of-magnitude indications and are sensitive to underlying assumptions, including the path of EUA prices and changes in EU and global aluminium demand. However, the central conclusion that CBAM levies will be modest initially but will increase sharply over the phase-in period appears robust across a range of plausible assumptions.
Indirect Aluminium Emissions
As indirect emissions account for a large share of aluminium production, they may be included in the CBAM in the future. With indirect emissions included, the CO2 intensity of primary aluminium production in Bahrain and the UAE is around 7.1 CO2e/t Al, while that in Saudi Arabia is about 10.0.[g] These numbers are lower than the CO2 intensity of aluminium production in China (12.0) and India (13.8). The key driver of these differences lies in the electricity used in the production process. India and China rely on electricity from coal, while GCC countries mainly use gas-fired electricity.
Meanwhile, the CO2 intensity of primary aluminium production in the EU when indirect emissions are included is 5.0 CO2e/t Al. This reflects the large proportion of low-carbon electricity generation in the region. Yet, although this intensity is lower than that of GCC countries, it does not necessarily mean that the CBAM will advantage EU producers. This is because national indirect cost compensation schemes use the “marginal plant approach,” in which compensation calculations typically use CO2 emissions factors of fossil fuel plants rather than actual electricity CO2 factors.[27] An indication that electricity payments are substantial is that European Aluminium, a member-based industry association, supports the exclusion of indirect aluminium emissions from the CBAM.[28] Consequently, EU producers could face substantial decreases in domestic support if indirect emissions were included in the CBAM and indirect cost compensations were wound down.
Secondary Aluminium and Resource Shuffling
The average CO2 intensity of secondary aluminium is 0.5 tCO2/t Al, with only small variations across producers.[29] As this is significantly lower than that of primary aluminium, the CBAM creates incentives for resource shuffling—the export of secondary aluminium to the EU, while primary aluminium is diverted to other markets. Current or proposed measures under the CBAM do not track firm-wide production portfolios or constrain exports of high-carbon aluminium to third markets. This leaves scope for significant resource shuffling.
Decarbonisation Initiatives
The above estimates for CBAM CO2 intensities and carbon charges reflect operations in 2023. As part of broader national strategies, GCC aluminium producers have ambitious plans to transition to clean energy, improve energy efficiency, and increase secondary aluminium production. Several of these green transformation initiatives are also motivated by the CBAM.[30]
Emirates Global Aluminium, for example, plans to reduce its CO2 intensity by 25 percent by 2035 (relative to 2020), and to reach net zero by 2050.[31] In Saudi Arabia, key efforts to lower the CO2 intensity of aluminium include building the world’s largest solar process steam plant to reduce refinery emissions, expanding recycling, and collaborating internationally on developing low-carbon smelting technologies to achieve carbon neutrality by 2050.[32] Aluminium Bahrain has stated that its decarbonisation efforts align with the national strategy to reduce GHG emissions by 30 percent by 2035 (relative to 2019), and achieve net zero by 2060.[33] Effective implementation of these strategies will be key to minimising the impact of the CBAM on GCC countries.
Conclusion
The EU’s CBAM entered its definitive phase on 1 January 2026. From this date, imports of covered goods face carbon charges that rise rapidly over time. At the same time, free allocations for domestic producers under the EU ETS are being phased out. The mechanism, therefore, affects both imported and EU-produced goods.
The initial impacts of the CBAM will be modest. This reflects the low initial coverage of embedded emissions and relatively limited CBAM obligations in the early years. Effects will, however, intensify over the next eight years as the CBAM is phased in and EUA prices are projected to rise.
For GCC countries, exposure to the CBAM is highly concentrated in aluminium. Bahrain and the UAE are particularly exposed in both absolute terms and relative to GDP. Saudi Arabia and Oman face more moderate exposure, while Kuwait and Qatar are largely unaffected.
Under current rules, only direct and precursor emissions from aluminium are covered. On this basis, the CO2 intensity of GCC aluminium production is similar to that of the EU and lower than that of China and India. As a result, CBAM-related price increases for GCC aluminium exports to the EU are comparable to those faced by EU producers and lower than those applied to some major competitors. This creates some scope for GCC producers to maintain or increase EU market share, although this may not offset the overall decline in EU demand.
The outlook would change materially if indirect emissions from electricity use were included in the CBAM. In that case, carbon charges on GCC aluminium exports would rise substantially. GCC producers would still be advantaged relative to those in China and India, who mainly rely on coal-fired electricity, but they will be disadvantaged relative to EU producers. The impact on competitiveness would depend critically on whether EU indirect cost compensation schemes are reduced in parallel. If compensation remains in place, GCC producers could be placed at a considerable disadvantage.
The CBAM also creates incentives for resource shuffling towards secondary aluminium, which has a much lower CO2 intensity. As GCC aluminium is mostly primary aluminium, global resource shuffling would see GCC aluminium exports to the EU diverted to other markets.
With the definitive phase of the CBAM in effect, decarbonisation and market-diversification strategies will be central to outcomes for GCCs. Ongoing investments in clean electricity, energy efficiency, and recycling will reduce future CBAM liabilities and help preserve market access. While the CBAM poses challenges, it has already acted as a catalyst for green transformation in the GCC aluminium sector. Gulf countries may also respond to the CBAM by implementing domestic carbon pricing for some products.
Looking ahead, other EU climate policies, including the Emissions Trading System 2 (ETS2), which covers emissions from fuels used in transport and buildings, may ultimately pose a larger risk to GCC economies than the CBAM.
Niven Winchester is Senior Fellow, ORF Middle East.
All views expressed in this publication are solely those of the author, and do not represent the Observer Research Foundation, either in its entirety or its officials and personnel.
Endnotes
[a] Iceland, Liechtenstein, and Norway participate in the EU ETS, and Switzerland has an ETS linked to the EU ETS
[b] The trade data are from the United Nations Commodity Trade Statistics (UN Comtrade) Database (United Nations, 2025) and are extracted from the World Integrated Trade Solution (WITS) database (World Bank, 2025) at the Harmonised System six-digit level and then assigned to the commodities listed in Table 1.
[c] Abdou et al. (2025) include both trade exposure and emissions intensity in calculating CBAM exposure and reach similar conclusions. Specifically, they find that the UAE has the most emissions exposed to CBAM, while Oman has the greatest burden as a percent of GDP.
[d] In global ranking calculations, the 27 member states of the EU are included in one region.
[e] The CBAM CO2 intensity estimates are approximated from Figure 9 in Hasanbeigi and Springer (2025) and exclude emissions from alumina production, which is not covered in the CBAM.
[f] Hasanbeigi and Springer (2025) do not include estimates for Oman. As GCC countries using similar aluminium production process, the CO2 intensity for Oman is likely similar to that for other GCC countries.
[g] Like direct CO2 intensity calculations, these numbers are estimated from Figure 9 in Hasanbeigi and Springer (2025).
[1] European Union, “Regulation (EU) 2023/956 of the European Parliament and of the Council of 10 May 2023 Establishing a Carbon Border Adjustment Mechanism (Text with EEA Relevance),” Official Journal of the European Union, 130/52, May 16, 2023, https://eur-lex.europa.eu/eli/reg/2023/956/oj.
[2] Niven Winchester, Sergey Paltsev, and John M. Reilly, “Will Border Carbon Adjustments Work?,” The B.E. Journal of Economic Analysis & Policy 11, no. 1 (2011): 1–29, https://doi.org/10.2202/1935-1682.2696.
[3] Frédéric Branger and Philippe Quirion, “Would Border Carbon Adjustments Prevent Carbon Leakage?,” Energy Economics 46, 2014, 61–70, https://doi.org/10.1016/j.ecolecon.2013.12.010.
[4] Jie Zhong and Jun Pei, “Carbon Border Adjustment Mechanism: A Systematic Literature Review of the Latest Developments,” Climate Policy 24, no. 2 (2023): 228–42, https://doi.org/10.1080/14693062.2023.2190074.
[5] Christoph Böhringer, Edward J. Balistreri, and Thomas F. Rutherford, “Carbon Policy and the Structure of Global Trade: Distributional Impacts of Border Carbon Adjustments,” World Economy 41, no. 1 (2018): 194–214, 194–221, https://doi.org/10.1111/twec.12535.
[6] Michael A. Mehling, Geoffroy Dolphin, and Robert A. Ritz, “The European Union’s CBAM: Averting Emissions Leakage or Promoting the Diffusion of Carbon Pricing?,” Journal of Environmental Policy & Planning 27, no. 6 (2025): 687–705, https://doi.org/10.1080/1523908X.2025.2591794.
[7] Directorate-General for Taxation and Customs Union, European Commission, “Guidance Document on CBAM Implementation for Installation Operators Outside the EU,” 2023, https://taxation-customs.ec.europa.eu/system/files/2023-12/Guidance%20document%20on%20CBAM%20implementation%20for%20installation%20operators%20outside%20the%20EU.pdf.
[8] European Commission, “Guidance Document on CBAM Implementation”.
[9] European Commission, “Carbon Border Adjustment Mechanism (CBAM): Questions and Answers,” July 19, 2024, https://sede.agenciatributaria.gob.es/static_files/Sede/Tema/Aduanas/Mercancias_trat_especial/CBAM/CBAM_FAQ_1721664049.pdf.
[10] European Union, “Regulation (EU) 2023/956 of the European Parliament and of the Council of 10 May 2023 Establishing a Carbon Border Adjustment Mechanism (Text with EEA Relevance)”.
[11] European Union, “Regulation (EU) 2025/2083 of the European Parliament and of the Council of 8 October 2025 Amending Regulation (EU) 2023/956 as Regards Simplifying and Strengthening the Carbon Border Adjustment Mechanism (Text with EEA Relevance),” Official Journal of the European Union, 2025/2083, October 17, 2025, https://eur-lex.europa.eu/eli/reg/2025/2083/oj.
[12] “A CBAM without Indirect Emissions? A Half‑Built Bridge to Decarbonisation,” Bellona Europa, June 23, 2025, https://eu.bellona.org/2025/06/23/a-cbam-without-indirect-emissions-a-half-built-bridge-to-decarbonisation/.
[13] European Commission, https://ec.europa.eu/commission/presscorner/detail/en/ip_25_3088.
[14] “World Integrated Trade Solution (WITS),” World Bank, https://wits.worldbank.org.
[15] “United Nations Commodity Trade Statistics Database (UN Comtrade),” United Nations Statistics Division, http://www.comtrade.un.org.
[16] Ali Hasanbeigi and Cecilia Springer, “Aluminum Climate Impact 2025: An International Benchmarking of Energy and CO₂ Intensities,” Global Efficiency Intelligence, 2025, https://www.globalefficiencyintel.com/aluminum-climate-impact-2025-an-international-benchmarking-of-energy-and-co2-intensities.
[17] European Commission, “Guidance Document on CBAM Implementation”.
[18] European Commission, “Guidance Document on CBAM Implementation”.
[19] “US Aluminium Smelting and Energy Costs: 3 Key Growth Factors,” Fastmarkets, October 21, 2025, https://www.fastmarkets.com/insights/us-aluminium-smelting-and-energy-costs-3-key-growth-factors/.
[20] European Commission, “Guidance Document on CBAM Implementation”.
[21] Hasanbeigi and Springer, “Aluminum Climate Impact 2025: An International Benchmarking of Energy and CO₂ Intensities”.
[22] Hasanbeigi and Springer, “Aluminum Climate Impact 2025: An International Benchmarking of Energy and CO₂ Intensities”.
[23] Hasanbeigi and Springer, “Aluminum Climate Impact 2025: An International Benchmarking of Energy and CO₂ Intensities”.
[24] ABN AMRO, “ESG Economist – Scenarios Shaping EU ETS Prices,” September 16, 2025, https://www.abnamro.com/research/en/our-research/esg-economist-scenarios-shaping-eu-ets-prices.
[25] Hasanbeigi and Springer, “Aluminum Climate Impact 2025: An International Benchmarking of Energy and CO₂ Intensities”.
[26] ABN AMRO, “ESG Economist – Scenarios Shaping EU ETS Prices.”
[27] European Commission, “Guidelines on Certain State Aid Measures in the Context of the System for Greenhouse Gas Emission Allowance Trading Post-2021 (Text with EEA Relevance),” Official Journal of the European Union C 317 (September 25, 2020): 5–22, eur-lex.europa.eu(01).
[28] European Aluminium, European Aluminium Position Paper on CBAM, April 23, 2025, https://european-aluminium.eu/wp-content/uploads/2025/04/2025-04-23-European-Aluminium-Position-Paper-on-CBAM.pdf.
[29] Hasanbeigi and Springer, “Aluminum Climate Impact 2025: An International Benchmarking of Energy and CO₂ Intensities”.
[30] “Gulf Aluminium Producers Push for Green Transformation Amid EU Carbon Tax Pressure,” GCC Business Watch, October 14, 2024, https://gccbusinesswatch.com/news/gulf-aluminium-producers-push-for-green-transformation-amid-eu-carbon-tax-pressure/.
[31] Emirates Global Aluminium (EGA), EGA 2024 Sustainability Report 2024, https://www.ega.ae/media/csdg3lpg/ega-2024-sustainability-report.pdf.
[32] “Saudi Ma’aden, GlassPoint Seek to Build World’s Largest Solar Powered Steam Plant,” Arab News, June 5, 2022, https://www.arabnews.com/node/2096826/business-economy.
[33] Aluminium Bahrain (Alba), Powering a Sustainable Future: ESG Report 2024, https://www.albasmelter.com/en/esgreport/index.html.