 Global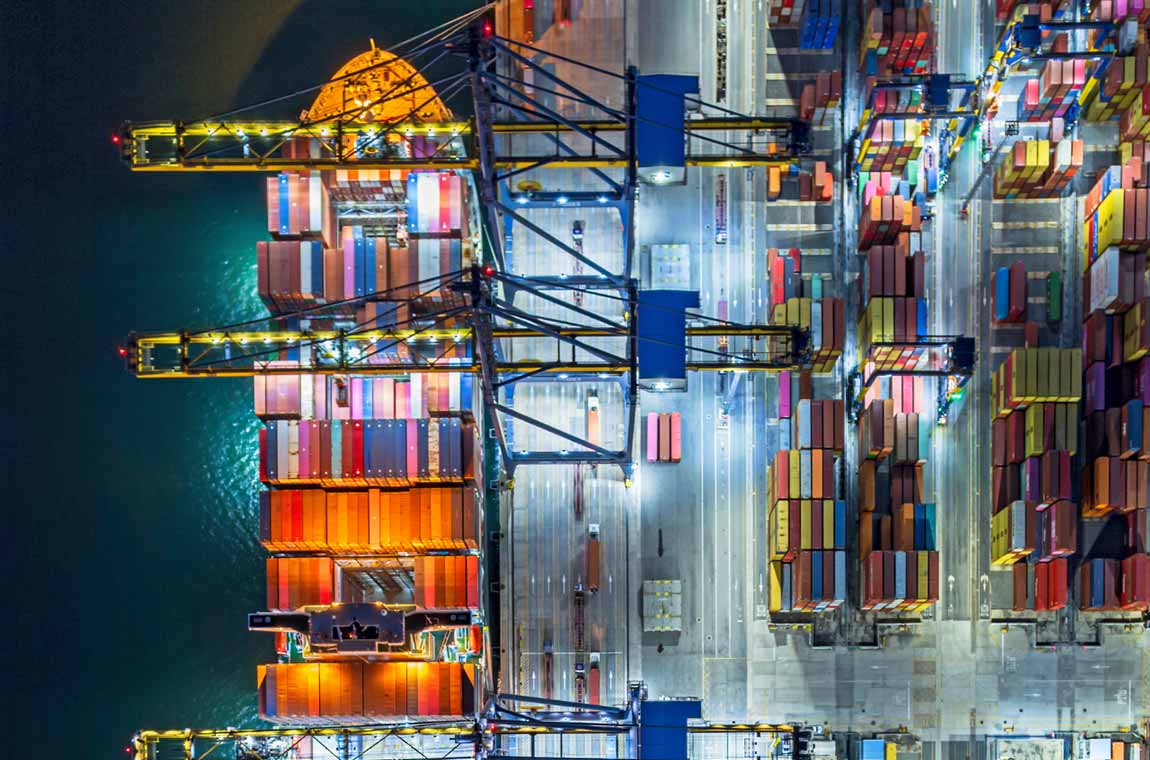
Expert Speak | 18 August, 2026
Choke Points: How Security and Politics are Impacting Supply Chains
The following excerpt is from Chapter 3 — ORF Global Quarterly | Energy and Tech: Powering the Future.
On 4 March 2026, Iranian forces declared the Strait of Hormuz closed following the United States (US)-Israel attack on Iran on 28 February. The disruption has had serious ramifications for global energy security. In 2025, nearly 15 million barrels of crude oil per day—around 34 percent of global crude oil trade—passed through the Strait, with most exports destined for Asian markets.[1] China and India alone received 44 percent of these exports.[2] Yet the closure of Hormuz is not the only recent incident to bring energy security, diversification, and the energy-climate-trade nexus to the forefront.
Over the past decade, three structural shifts have been reordering global energy trade, encompassing not only traditional oil and gas flows but also the rapidly growing cross-border trade in electricity and clean energy goods.
First, supply chains in energy, clean technology, and critical raw materials have become increasingly securitised, with states treating dependencies as national security liabilities rather than economic efficiencies. Second, trade corridors have diversified, driven by geopolitical tensions and infrastructure competition. Third, the relationship between energy security, climate policy, and trade governance has evolved into an increasingly interconnected nexus, where a security shock in energy markets can immediately reprice climate commitments and reshape trade flows, while trade policy instruments such as carbon border tariffs feed back into both energy investment decisions and geopolitical posturing.
The Hormuz disruption has underscored the vulnerability of critical maritime chokepoints to geopolitical tensions and their potential to transmit shocks across supply chains and commoditymarkets, with repercussions similar to those observed during the three-year COVID-19 pandemic starting in 2020 and the Russia- Ukraine conflict that erupted in 2022.
This article examines how these structural shifts and trends are not coincidental but causally linked and what their entrenchment means, particularly for the Global South, which sits at the sharpest edge of all three.
The Uneven Costs of Geo-Economic Fragmentation
The logic of securitisation—treating supply disruptions as existential threats that warrant state intervention—is not new to energy markets. The 1973 Arab oil embargo and the 1979 Iranian Revolution produced lasting institutional responses—among them, strategic petroleum reserves, the International Energy Agency’s (IEA) emergency-sharing system, the institutionalisation of Organization of the Petroleum Exporting Countries (OPEC), the petrodollar architecture, and a generation of energy policies built around import diversification. What is new is the breadth of securitisation; its extension beyond fossil fuel supplies to clean technology supply chains, critical raw materials, and the industrial base of the energy transition itself.
The COVID-19 pandemic exposed the fragility of global supply chains and the concentration of essential goods production in a handful of countries. Russia’s invasion of Ukraine in 2022 demonstrated how energy dependencies could be weaponised within weeks, forcing policy reversals, particularly in Europe. At the same time, intensifying US-China strategic competition increasingly recast economic interdependence as strategic vulnerability, most visibly in semiconductors, electric vehicles, and battery technology. The 2026 Hormuz crisis, in this sequence, underscored rather than initiated this trend.
Trade barriers, which generally declined throughout the 20th century, have reversed course over the past decade.[3] The International Monetary Fund (IMF) defines this phenomenon as “geo-economic fragmentation”: a policydriven reversal of economic integration, of which international trade is a central component.[4] The resulting domestic content mandates, friend-shoring policies, and technology export controls risk constraining the diffusion of clean technologies, especially across the Global South.
For energy systems specifically, this reversal is particularly consequential. Fragmentation in the trade of critical energy-transition minerals such as copper, nickel, cobalt, and lithium would increase the cost of the transition. Since these minerals are geographically concentrated and not easily substituted, disrupting their trade could lead to sharp swings in prices, suppressing investment in renewables and EV production.
Critical mineral markets have become more concentrated; for copper, lithium, nickel, cobalt, graphite, and rare-earth elements, the average market share of the top three refining nations rose to 86 percent in 2024 from around 82 percent in 2020, with almost all supply growth coming from the single top supplier—Indonesia for nickel, and China for all others.[5]
The concentration extends beyond minerals into manufacturing. China controls over 80 percent of global solar panel production across the entire value chain—polysilicon, wafers, cells, and modules—meaning that the clean energy transition is structurally dependent on a geographically concentrated supply chain.[6]
Figure 1: Share of Top Producers of Refined Energy-Related Strategic Minerals
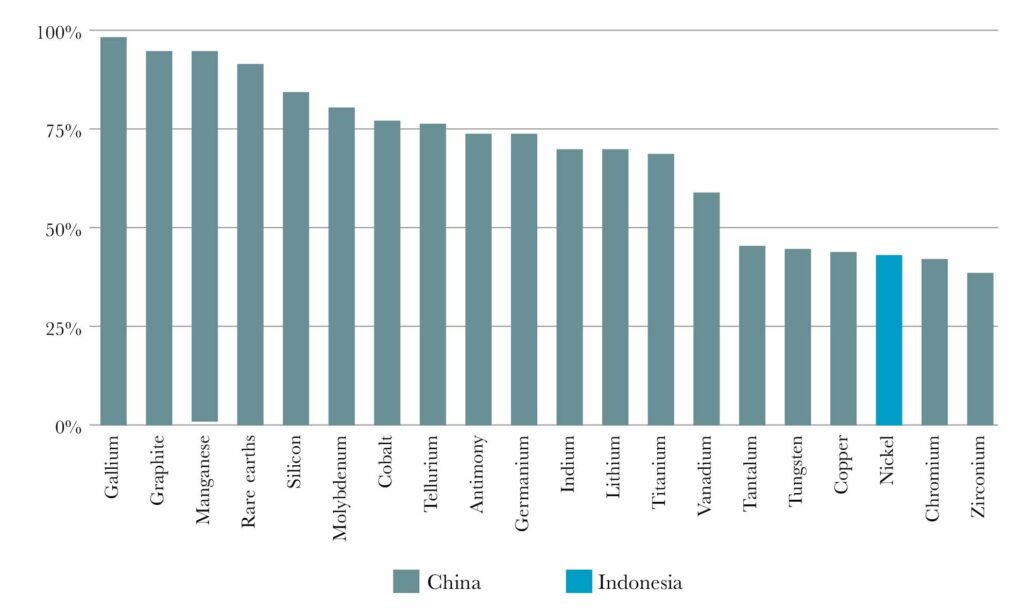
Source: IEA[7]
In December 2024, China restricted exports of gallium, germanium, and antimony to the United States, followed in early 2025 by further restrictions covering tungsten, tellurium, bismuth, indium, molybdenum, and seven heavy rare-earth elements.[8] Currently, more than half of a broader group of energy-related minerals are subject to some form of export controls. While some of these controls were partially suspended under the November 2025 US-China trade truce, licensing requirements remain and the broader export control architecture is intact.[9] These are not merely commercial decisions; they are instruments of strategic statecraft, accelerating a race among consuming nations to secure alternative sources of supply.
States have responded to these concentration risks through an expanding body of industrial policy legislation. The US Inflation Reduction Act (IRA, 2022) operationalised supplychain securitisation through domestic content requirements for clean energy tax credits, linking federal subsidy eligibility to sourcing from allied nations and explicitly excluding supply chains tied to designated foreign adversaries, effectively restructuring solar, battery, and EV supply chains around geopolitical alignment rather than economic efficiency.[10] The model is spreading, and post-Hormuz IRA-style domestic content logic is being actively discussed across countries as a template for energy transition resilience.
The EU Carbon Border Adjustment Mechanism (CBAM), which entered its definitive phase on 1 January 2026, is the most direct institutional expression of the energyclimate- trade nexus.[11] By imposing carbon costs on approximately €50 billion in annual imports across six sectors—cement, iron and steel, aluminium, fertilisers, electricity, and hydrogen—CBAM links trade access to climate performance.[12] It is simultaneously a climate instrument, a trade policy, and an industrial competitiveness measure. It is the first fully operational policy to begin charging costs based on the emissions intensity of imported goods, marking the first time that the price of carbon in a certain jurisdiction has been externalised beyond its borders.[13] CBAM is the clearest example yet of the energy-climate-trade nexus hardening into regulatory architecture.
The Global South Asymmetry
The costs of securitisation are not distributed evenly. Financing costs in emerging economies remain up to seven times higher than in advanced markets, exacerbating a US$2.2- trillion annual investment gap for clean energy.[14] For the Global South, securitisation compounds this disadvantage in a specific way: legislative instruments of the North such as IRA, CBAM, and the EU Net-Zero Industry Act are designed to serve Northern industrial policy objectives, but their effects fall heavily on Southern export economies.
Figure 2: The Costs of Fragmentation
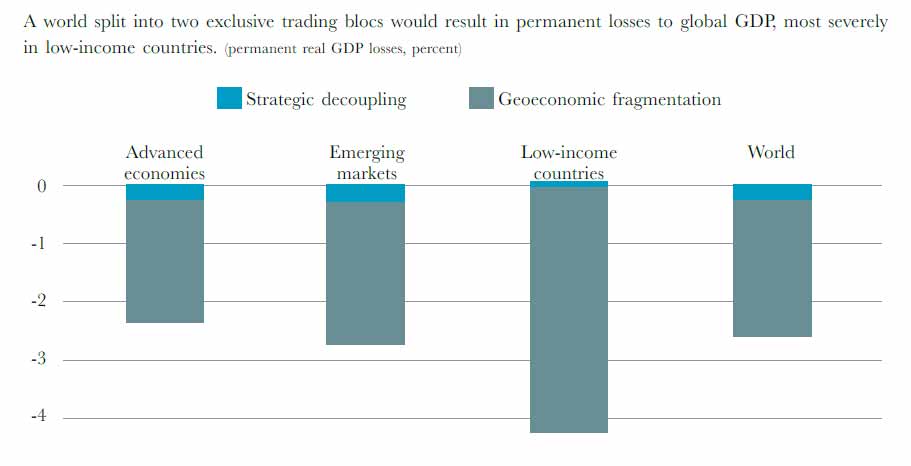
Source: IEA[15]
For example, under CBAM, countries like India, Egypt, South Africa, and Morocco face a carbon tariff on their exports of steel, cement, and fertilisers—sectors where decarbonisation requires capital investment that those economies cannot readily mobilise. The instrument is already generating reactive policy responses. India introduced greenhouse gas emissions-intensity targets for an additional 208 industrial units in January 2026, bringing petroleum refineries, petrochemicals, textiles, and secondary aluminium into its carbon market as a CBAM resilience measure.[16] Yet reactive carbon pricing under fiscal pressure is not the same as a genuine just transition.
Emerging markets and low-income countries tend to be most at risk from trade and technology fragmentation. Because they remain further from the technological frontier, they lose disproportionately when access to embodied technology, knowledge spillovers, and R&D is restricted. The clean energy transition, premised on global supply chains and comparative advantage, is thus being re-engineered as a theatre of strategic competition.
As the World Economic Forum’s Global Risks Report 2026 notes, geoeconomic confrontation is now a key driver of economic and industrial policy, and the broader signal from recent disruptions is a shift towards resilience and diversification across global supply chains.[17] Supply chain securitisation does not only reshape what is produced and where, it reshapes how goods move. As states treat energy and material dependencies as strategic liabilities, the corridors through which energy travels become as contested as the commodities themselves.
Diversification of Trade Corridors
A succession of multi-scalar supply-chain shocks over the last decade has structurally destabilised global trade corridors, precipitating significant contractionary pressures on aggregate economic growth. An estimated 15 percent of global trade flows were disrupted by geopolitical tensions and climate-related events during this period.[18] In 2024 alone, systemic supply-chain dislocations precipitated an estimated 7 percent contraction in global gross domestic product (GDP), representing an aggregate economic loss of approximately US$7.77 trillion, equivalent to the GDP of Japan, assuming a global GDP of US$110.98 trillion.[19]
Deliberately redistributing trade flows across alternative geopolitical, geographic, and modal routes, replacing or supplementing dominant chokepoint-dependent pathways, builds resilience and security but often comes with energy and emissions penalties.[20] The extent of the penalties depends on the transport mode, fuel type, and distance involved. In alternative corridors that involve shorter distances, efficient transportation modes and low-emissions fuels, energy and emissions penalties can be lower or even negative.[21]
International trade-related freight transport currently accounts for around 30 percent of all transport-related carbon emissions from fuel combustion and more than 7 percent of global emissions.[22] Global trade remains fundamentally dependent on maritime transport, which has the lowest freight-mode carbon intensity. More than 80 percent of world merchandise trade by volume moves by sea, and maritime shipping alone contributes roughly 2.8–3 percent of global carbon emissions.[23] The emissions outcome of diversification is therefore not predetermined— it depends on route, mode, infrastructure, energy use and regional industrial geography; and the evidence is decidedly mixed.
The Suez Canal-Red Sea corridor normally handles 30 percent of global container traffic. Disruptions in October 2023 forced rerouting freight traffic to the Cape of Good Hope, which added about 4,000 nautical miles (nm) per voyage.[24] This increased GHG emissions by 70 percent per round trip for Asia–Europe routes. According to mandatory carbon-emissions reporting data, EU container-shipping CO₂ emissions increased to 52.7 Mt (million tons) in 2024 compared to 34.7 Mt when the Suez corridor was used, which is an 18 Mt carbon penalty.[25] The 2026 Hormuz closure is now replicating this dynamic as Asian refiners reroute tanker traffic around the Arabian Peninsula and towards the Cape of Good Hope.
Before 2022, the Northern Corridor, a remarkably direct, nearly straight, east-west rail line from Vladivostok to the Port city of Brest in France, accounted for 86 percent of China- Europe rail freight, while the Middle Corridor from Chengdu in China to Istanbul in Türkiye constituted less than 1 percent.[26] Following the conflict in Ukraine, freight volumes shifted to the Middle Corridor. The forced diversification from a high-capacity, relatively efficient Trans- Siberian rail corridor to the multi-model (rail–ferry–rail) Middle Corridor introduced inefficiencies that increased the energy overhead per tonne and consequently the carbon emissions per tonne of goods transported.[27]
Geoeconomic confrontation is now a key driver of economic and industrial policy, and the signal from recent disruptions is a shift towards resilience and diversification
The China Railway Express (CRE), often described as a “Suez Canal on rails”, is not a direct corridor replacement but a strategic alternative to Suez-dependent sea routes, connecting 226 cities across 25 European countries and more than 100 cities in 11 Asian countries.[28] It is 65 percent faster than the Suez route, though more expensive.[29] Its climate credentials remain contested: despite an 11,000-kilometre distance reduction, studies indicate that a 90-percent cut in emissions intensity relative to current levels would be required for a net environmental benefit over sea freight, while a separate city-level analysis finds CRE services reduced CO₂ emissions by an average of 9 percent across 12 cities with regular operations.[30] CRE diversification is likely to carry climate benefits where it displaces air freight for export of electronics, automotive components, and other high-value items.[31]
When alternative corridors reduce per-unit transportation emissions, they simultaneously induce systemic trade demand. This manifestation of the Jevons paradox[32] implies that volume expansions within optimised corridors can partially or fully neutralise the projected net emissions reduction.[33] The Arctic Sea Route (ASR) illustrates this most sharply, reducing voyage distances between Europe and Northeast Asia by up to 40 percent; it is projected to increase global shipping emissions by 8.2 percent by 2100, with Arctic-specific emissions rising from 0.22 percent to 2.72 percent driven by induced demand, where lower costs stimulate additional shipping that cancels out per-voyage efficiency gains.[34]
The emissions burden of corridor disruption and rerouting falls asymmetrically. When chokepoints close or become unsafe, it is import-dependent economies in South Asia and Southeast Asia, with thinner fiscal buffers and less diversified supplier bases, that face the sharpest freight cost spikes and the longest rerouting delays.
The Energy-Climate-Trade Nexus
Global economic strategy is shifting from prioritising narrow cost efficiency to emphasising resilience through the diversification of trade corridors.[35] While diversified corridors reduce systemic vulnerability by spreading geopolitical and supply-chain risk, they can also increase energy intensity and lock-in higher emissions by duplicating production and transport infrastructure across less efficient, higher-cost locations.
Where corridor planning is integrated with scalable low-emissions fuels and advanced digital logistics (optimising routing, modal choice, and asset utilisation), much of the additional energy burden can be mitigated. Conditioning corridor financing on robust lifecycle-based GHG monitoring and reporting would align commercial incentives with climate objectives and create accountability for embodied emissions across routes and modes.
Yet the evidence suggests that such mitigation measures run counter to current policy momentum. Emergency rerouting locks in emissions-intensive pathways; induced demand erases efficiency gains; and the Global South absorbs the costs of both without meaningful participation in the governance conversations that determine corridor terms.
The proposed India-Middle East-Europe Economic Corridor (IMEC), designed to transport low-emissions energy exports from India to European markets, illustrates how strategic corridor design can reconcile resilience with climate action.[36] Stalled since late 2023 by the Gaza conflict and regional instability, when combined with low-emissions supply sources, interoperable clean-energy infrastructure, and lifecycle emissions verification, IMEC represents the most concrete test yet of whether trade corridors can be designed to serve both security and climate objectives simultaneously, though sustained political commitment and predictable financing remain preconditions for that ambition to materialise.
The nexus is entrenching not because states are governing energy, climate, and trade coherently—they are not—but because disruption in any one domain now automatically destabilises the other two. The Hormuz crisis did not create that interdependency. It revealed how deeply it had already taken hold, and how unevenly its costs are distributed: a reckoning that the current architecture of securitisation, corridor competition, and asymmetric climate governance is not yet equipped to address.
Parul Bakshi is Fellow, Energy and Climate, ORF Middle East.
Lydia Powell is Distinguished Fellow, ORF.
[1] “Strait of Hormuz – Factsheet,” International Energy Agency, February 2026, https://www.iea.org/about/oil-securityand- emergency-response/strait-of-hormuz.
[2] “Strait of Hormuz – Factsheet”.
[3] Marijn A. Bolhuis et al., “The Costs of Geoeconomic Fragmentation,” International Monetary Fund, June 2023, https://www.imf.org/en/publications/fandd/issues/2023/06/the-costs-of-geoeconomic-fragmentation-bolhuis-chenkett.
[4] Shekhar Aiyar et al., “Geo-Economic Fragmentation and the Future of Multilateralism,” IMF Staff Discussion Notes 2023, no. 001 (2023): 1, https://doi.org/10.5089/9798400229046.006.
[5] “Critical Minerals – A New Frontier for Global Energy Security,” International Energy Agency, https://www.iea.org/ topics/critical-minerals.
[6] “Executive Summary – Solar PV Global Supply Chains,” July 7, 2022, https://www.iea.org/reports/solar-pv-globalsupply- chains/executive-summary.
[7] “Executive Summary – Global Critical Minerals Outlook 2025 – Analysis,” International Energy Agency, June 2025, https://www.iea.org/reports/global-critical-minerals-outlook-2025/executive-summary.
[8] “Executive Summary – Global Critical Minerals Outlook 2025 – Analysis”.
[9] “Fact Sheet: President Donald J. Trump Strikes Deal on Economic and Trade Relations with China,” The White House, November 1, 2025, https://www.whitehouse.gov/fact-sheets/2025/11/fact-sheet-president-donald-j-trump-strikes-dealon- economic-and-trade-relations-with-china/.
[10] U.S Department of Energy, “Inflation Reduction Act of 2022,” Energy.Gov, May 11, 2026, https://www.energy.gov/edf/ inflation-reduction-act-2022.
[11] “CBAM Successfully Entered into Force on 1 January 2026,” Taxation and Customs Union, January 14, 2026, https:// taxation-customs.ec.europa.eu/news/cbam-successfully-entered-force-1-january-2026-2026-01-14_en.
[12] Raj Deshmukh, “CBAM 2026: Complete Guide to EU Carbon Border Tax Reshaping Global Trade,” Informed Clearly, April 14, 2026, https://informedclearly.com/en/environment/48223/cbam-carbon-border-tax-eu-guide-2026.
[13] “The Impact of the EU’s CBAM on Business and the Carbon-Pricing Landscape,” World Economic Forum, December 15, 2025, https://www.weforum.org/stories/2025/12/eu-cbam-impact-business-carbon-pricing-landscape/.
[14] “Fostering Effective Energy Transition 2025,” World Economic Forum, June 18, 2025, https://www.weforum.org/ publications/fostering-effective-energy-transition-2025/in-full/introduction-c2a484c547/.
[15] Bolhuis et al., “The Costs of Geoeconomic Fragmentation”.
[16] Ministry of Environment, Forest and Climate Change, Government of India, https://www.pib.gov.in/www.pib.gov.in/ Pressreleaseshare.aspx?PRID=2217239.
[17] “The Global Risks Report 2026,” World Economic Forum, January 14, 2026, https://www.weforum.org/publications/ global-risks-report-2026/in-full/global-risks-report-2026-key-findings/.
[18]18 “Why Trade Corridors Are the Path to a More Resilient Future,” World Economic Forum, January 16, 2025, https://www.weforum.org/stories/2025/01/trade-corridors-resilient-future/.
[19] “World Economic Outlook, October 2024: Policy Pivot, Rising Threats,” International Monetary Fund, October 2024, https://www.imf.org/en/publications/weo.
[20] Qi Xu et al., “Eurasian Container Intermodal Transportation Network: A Robust Optimization with Uncertainty and Carbon Emission Constraints,” Frontiers in Marine Science 12 (2025), https://www.frontiersin.org/journals/marine-science/ articles/10.3389/fmars.2025.1576006/full.
[21]
21 Fabio Indeo, “Reshaping the India-Middle East-Europe Economic Corridor: New Challenges, Old Vulnerabilities,” TRENDS Research & Advisory, February 15, 2026, https://trendsgroup.org/insight/reshaping-the-india-middle-easteurope- economic-corridor-new-challenges-old-vulnerabilities/.
[22] Đurđica Stojanović et al., “Assessment of International Trade-Related Transport CO2 Emissions—A Logistics Responsibility Perspective,” Sustainability 13, no. 3 (2021): 1138, https://www.sciencegate.app/document/10.3390/ su13031138.
[23] United Nations Conference on Trade and Development, Review of Maritime Transport 2023 (2023), https://unctad.org/ system/files/official-document/rmt2023_en.pdf.
[24] Sadeque Hamdan et al., “Optimizing Asia–Europe Container Network: The Suez Canal and Cape of Good Hope Routes in a Changing World,” European Journal of Operational Research 325, no. 1 (2025): 167–88, https://www.sciencedirect. com/science/article/pii/S037722172500205X.
[25] Stuart Todd, “45% Surge in EU Containership Emissions Due to Shipping Disruption in the Red Sea,” American Journal of Transportation, July 24, 2025, https://www.ajot.com/insights/full/ai-45-surge-in-eu-containership-emissionsdue- to-shipping-disruption-in-the-red-sea.
[26] Alberto Rizzi, “Risk and Reward: Why the EU Should Develop the Middle Corridor Trade Route,” European Council on Foreign Relations, April 11, 2024, https://ecfr.eu/article/risk-and-reward-why-the-eu-should-develop-the-middle-corridor-trade-route/.
[27] Rizzi, “Risk and Reward: Why the EU Should Develop the Middle Corridor Trade Route”.
2[28]8 Sophia Shkuro, “Eurasian Railway Corridor: Overview of 2024 Trends in Rail Freight from China to Europe,” SeaRates, December 30, 2024, https://www.searates.com/blog/post/eurasian-railway-corridor-overview-of-2024-trends-in-railfreight- from-china-to-europe; Nick Staunton, “China Built a New Route to Europe — Now It Will Reshape Global Trade,” Business, March 20, 2026, https://europeanbusinessmagazine.com/china-built-a-new-route-to-europe-now-it-will-reshape-global-trade/.
[29] Staunton, “China Built a New Route to Europe — Now It Will Reshape Global Trade”.
[30] Yilin Zhang et al., “Impact of CR Express and Intermodal Freight Transport Competition on China-Europe Route: Emission and Welfare Implications,” Transportation Research Part A: Policy and Practice 171 (2023): 103642, https://www. sciencedirect.com/science/article/abs/pii/S0965856423000629; Peiming He et al., “Unintended Environmental Gains: The Impact of China–Europe Railway Express on Carbon Dioxide Emissions in China,” Transport Policy 153 (July 2024): 127–40, https://www.sciencedirect.com/science/article/abs/pii/S0967070X24001379.
[31] Staunton, “China Built a New Route to Europe — Now It Will Reshape Global Trade”.
[32] Jevons Paradox, first observed by economist William Stanley Jevons in 1865 refers to the counterintuitive idea that improvements in resource efficiency often increase overall consumption rather than reduce it.
[33] Pengjun Zhao et al., “Arctic Sea Route Access Reshapes Global Shipping Carbon Emissions,” Nature Communications 16 (September 2025): 8431, https://www.nature.com/articles/s41467-025-64437-4.
[34] Zhao et al., “Arctic Sea Route Access Reshapes Global Shipping Carbon Emissions”.
[35]35 “The Belt and Road Initiative: Impacts on Global Maritime Trade Flows,” International Transport Forum Discussion Papers no. 2020/02, vol. 2020/02, https://www.itf-oecd.org/sites/default/files/docs/belt-road-initiative-maritimetrade- flows_1.pdf.
[36] European Union Institute for Security Studies, From Hype to Horizon: What the EU Needs to Know to Bring IMEC to Life (2024), https://www.iss.europa.eu/publications/briefs/hype-horizon-what-eu-needs-know-bring-imec-life.