Expert Speak | 23 May, 2026
The Economic Implications of the Middle East Crisis: Measuring Preparedness in the MENA
The following excerpt is from Chapter 2 — Shifting Sands: A Middle East in Conflict and Transition.
The Arab region faces multiple acute fragilities. Seven countries are classified by the World Bank as fragile or conflict-affected.[1] Climate change is straining productive systems and societies, affecting agricultural output (and related employment) and putting pressure on infrastructure. Growth has been tepid and is failing to reduce persistently high youth unemployment rates, while food insecurity has deepened.
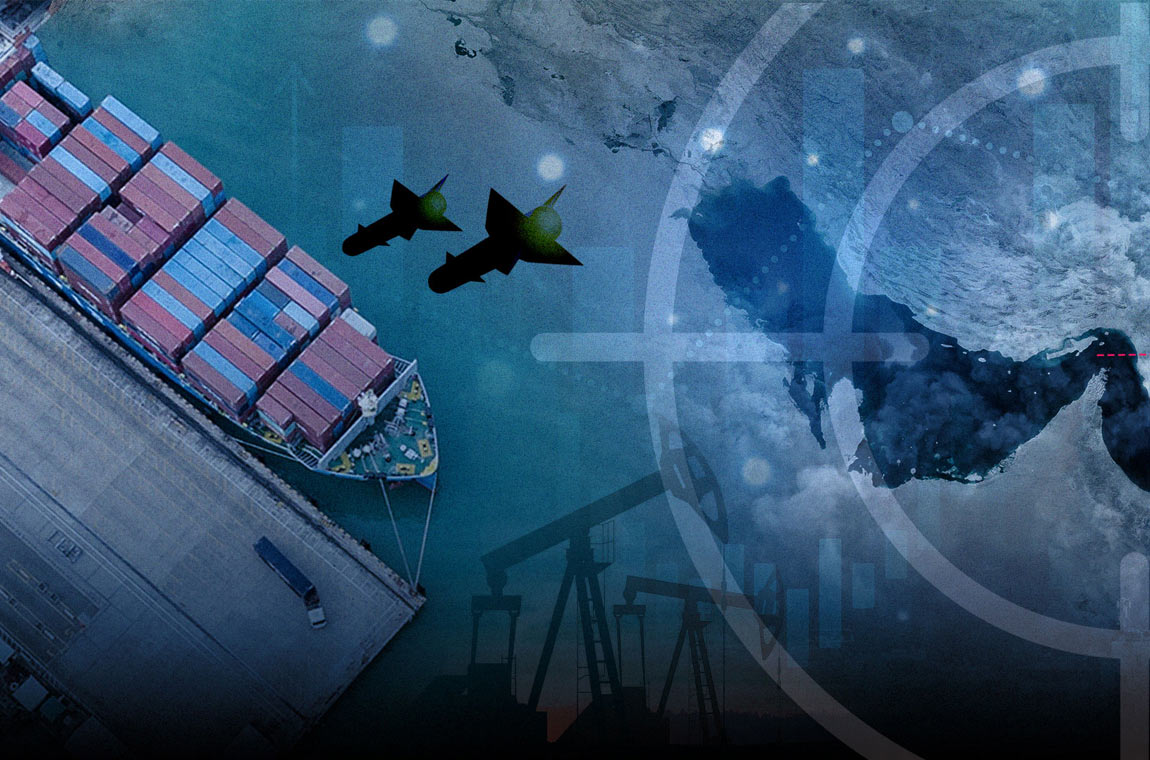
As a result, the region remains vulnerable to recent shocks, and the unfolding Middle East crisis could have serious implications to these economies. The April 2026 World Economic Outlook[2] and Regional Economic Outlook for the Middle East and Central Asia,[3] both by the International Monetary Fund (IMF), project a sharp decline in growth across the Middle East, North Africa, Afghanistan and Pakistan (MENAP) region, with forecasts revised down to 1.4 percent—2.3 percentage points decrease from projections made last October. But this accounts for sharp economic compressions in Gulf countries, particularly those most dependent on the Hormuz Strait for their exports, with expected downward revisions of up to 15 percentage points.
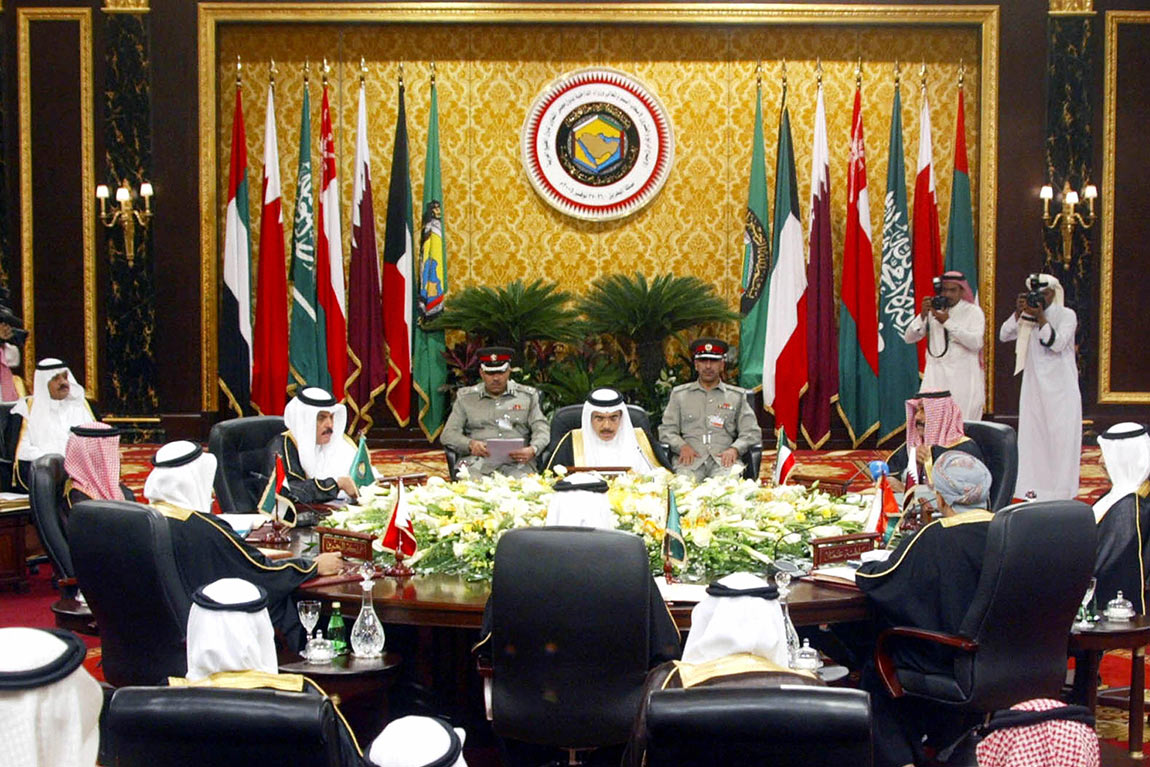
This article proposes a general, introductory framework to assess the preparedness of select non-Gulf, majority-Arabic-speaking countries in the MENAP region to cushion the unfolding shock. Deliberately, the article does not cover member states of the Gulf Cooperation Council (GCC): although they are in the eye of the storm, these high-income economies can arguably collectively weather the shock owing to their vast endowments in sovereign wealth.
Roughly, and despite disparities within each category, the analysis of select metrics justifies dividing studied countries into three categories: non-GCC member states of the Organisation of Petroleum Exporting Countries (OPEC); non- OPEC, conflict-affected countries; and nonconflict- affected, triple-deficit (energy, fiscal and current account) countries. Fundamentally, the authors’ observations confirm the capital importance of expertise embeddedness, political stability, and reform-mindedness to adapt to multiplying shocks.
Measuring Preparedness
Table 1. Economic Preparedness Profiles in Select Arab Economies
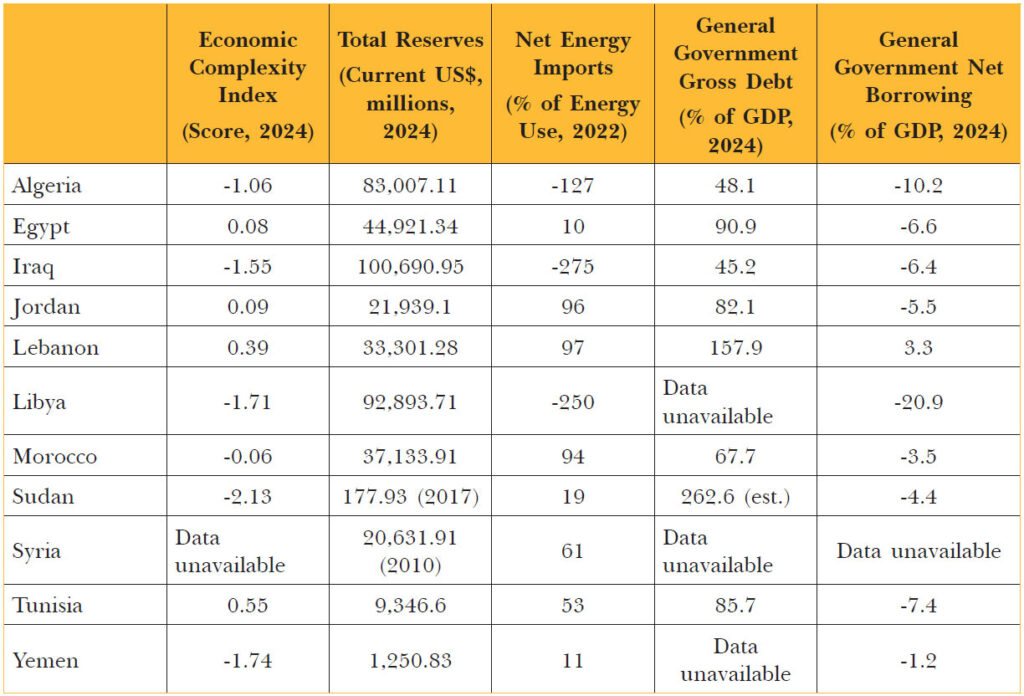
Sources: Atlas of Economic Complexity, IMF, World Bank[4]
The metrics proposed in the following paragraphs are not exhaustive but provide a useful overview. Typically, they could be complemented by data measuring exposure to certain categories of external financing (for instance, remittances from Gulf countries), fiscal flexibility (e.g., transfers to state-owned enterprises and subsidies, notably on fossil fuels), the quality of macroeconomic management (as expressed by inflation rates), or the overall trajectory of the studied economies (such as observed trends in growth or gross fixed capital formation).
Net Energy Imports as Share of Consumption
While the MENA region includes major energy exporters, it also includes countries that import the vast majority of their energy consumption (over 90 percent in three cases).[5] When the current account balance of net importing countries suffers from hikes in energy prices, net exporters can experience windfalls. Examining the current account deficit can serve as a complement, as it provides further insights into the additional stress that a higher energy bill can bring on the external financing needs, foreign currency reserves, and overall trade conditions of net importers.
General Government Gross Debt
Government gross debt-to-GDP ratios indicate fiscal discipline and provide a snapshot of a country’s capacity for fiscal response during periods of stress. Importantly, whether levels decrease over time provides indications on the robustness of fiscal policy. Ratios were steep in Lebanon (157.9 percent), which defaulted on its sovereign debt in 2020, but stood below 50 percent in fuel-exporting Iraq and Algeria.
General Government Net Borrowing
General government net borrowing (i.e., fiscal balance) serves as an indicator of a country’s ability to manage public spending. Containing spending, in turn, is an indication of the ability to rationalise it or direct it towards domains or sectors where possible returns can be highest. It is also how fiscal buffers are constituted, which allows for more flexibility in adverse circumstances. The fiscal balance should be read dynamically: if it decreases, it may be an indication of ongoing fiscal consolidation, a complex and high-stakes process which can speak of policy sophistication. Amongst the countries studied in this article, Morocco stands out for a relatively healthier fiscal position (3.5 percent fiscal deficit). Libya stands on the other end of the spectrum: its deficit (20.9 percent) indicates serious economic mismanagement.
Foreign Reserves
Total foreign reserves, as reported by the World Bank, serve as a sovereign economy’s primary buffer against external shocks: financing import disruptions, stabilising exchange rates, and maintaining debt servicing when revenues fall.6 Iraq (US$100.7 billion) and Libya (US$92.9 billion) hold the largest reserves; Algeria (US$83.0 billion) and Egypt (US$44.9 billion) offer meaningful, though more constrained, cover. At the extreme of vulnerability sit Sudan (US$178 million, last reported in 2017), and Syria, where reserves (US$20.6 billion in 2010) have collapsed to an estimated US$200 million by December 2024.[7]
Economic Complexity Index
The Economic Complexity Index (ECI), maintained by the Harvard Kennedy School’s Growth Lab, measures the productive knowledge embedded in a country’s export basket.[8] Higher values generally reflect more diversified, sophisticated economies, stronger technology embeddedness in domestic production, greater participation in complex global value chains driven by higher competitiveness, and more skilled employment and management. It also demonstrates the ability to conduct successful industrial policy—another indicator of policy sophistication. From this standpoint, countries like Tunisia (0.55) and Jordan (0.09) may still demonstrate adaptive capacity. Sudan (−2.13), Yemen (−1.74), and Libya (−1.71), all in the midst of conflicts, are the most acutely exposed.
Understanding Preparedness
Energy Exporters: The Liquidity Firewall
Iraq, Algeria, and Libya are in the best position to absorb the immediate shock. All three are net energy exporters: Iraq at −275 percent of energy use, Libya at −250 percent, and Algeria at −127 percent. Their reserves reinforce this position: Iraq holds the sample’s largest cushion at US$100.7 billion, followed by Libya at US$92.9 billion and Algeria at US$83.0 billion. Debt burdens are comparatively the most manageable: Iraq at 45.2 percent of GDP and Algeria at 48.1 percent, the two lowest ratios with available data.
Therefore, economic preparedness for this crisis exists despite their structural lack of economic sophistication. United by their status as fuel-exporting states, they share markedly lower ECI scores: Iraq (−1.55), Algeria (−1.06), and Libya (−1.71). However, in the acute phase of an exogenous shock, industrial diversification is secondary to brute liquidity and energy sovereignty.
However, the closure of the Strait of Hormuz reveals a stark geographic bifurcation within this cohort’s resilience. For the North African producers, Algeria and Libya, a Hormuz blockade represents a pure macroeconomic windfall, as their hydrocarbon export infrastructure routes face no logistical disruption from an Arabian- Persian Gulf chokepoint closure.[9] Instead, they stand to reap immense financial benefits from the resulting catastrophic spike in global energy prices, heavily reinforcing their liquidity firewalls.
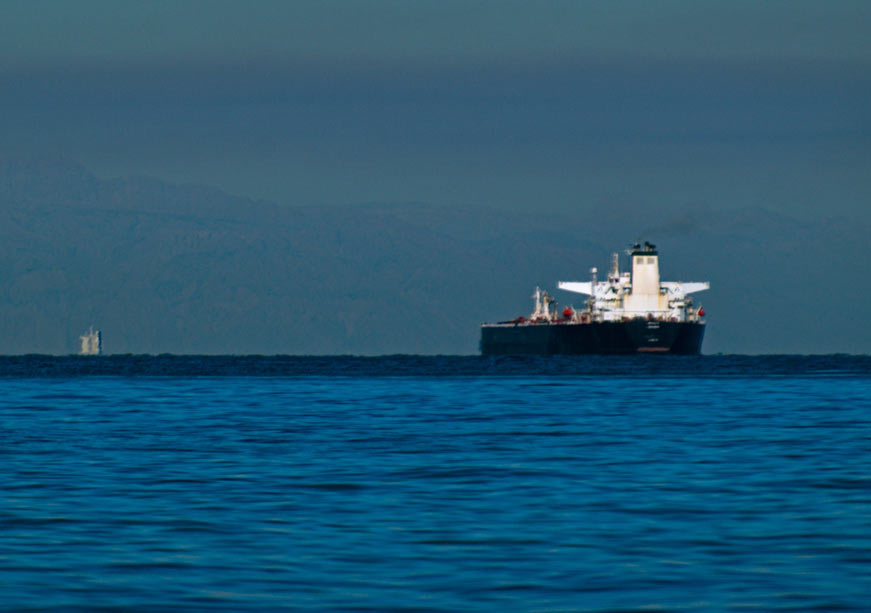
Conversely, Iraq faces acute physical vulnerability, as the overwhelming amount of Iraqi crude is exported via the Strait of Hormuz. Iraq exports approximately 93 percent of its crude through Basra’s Gulf terminals.[10] As this maritime artery is severed, Iraq’s primary revenue mechanism drops significantly. Despite this geographic divergence, they remain grouped together because their initial shock-absorption pattern is identical. In the face of this crisis, the “resource curse” is observed to reverse and present a “resource boon” instead.[11]
Non-Conflict Affected, Triple-Deficit Countries: Reform Means Protection
The group of non-conflict-affected, lower-middle income countries comprises Egypt, Jordan, Morocco, and Tunisia. These economies share several structural features, including greater reliance on productive sectors and tourism for foreign exchange, employment, revenue, and trade, as well as relatively higher ECI scores, indicating strong economic fundamentals. Yet, the dynamics within the group diverge widely.
While relatively robust monetary frameworks and foreign exchange reserves provide some stability, Jordan faces several vulnerabilities. It is the most energy import-dependent of the four (96 percent) and has limited fiscal space, with the highest central government debt-to-GDP ratio (95.90 percent) and the second-highest fiscal deficit (5.45 percent).
Egypt and Tunisia import less energy (net imports were, respectively, about a tenth and half of total use for the year considered), but both display relatively high levels of government debt-to-GDP (between 85 and 90 percent). That said, their exposure markedly differs. Egypt has engaged the IMF and international partners, which have provided financial resources in exchange for a series of reforms, including fiscal consolidation and exchange regime liberalisation, which should help navigate the current shock. In contrast, rigid policymaking and a lack of substantial reforms (on energy subsidies, for instance) will weigh on Tunisia’s budget, currency, and trade.
Last, Morocco appears to have the most robust policymaking, with ongoing fiscal consolidation driving the fiscal deficit to about 3 percent and the central government debt-to-GDP ratio below 70 percent. As a result, the country appears to be better endowed with fiscal buffers and therefore best prepared to absorb the shock.
However, despite having more complex economies indicated by relatively higher ECI scores, paradoxically and overall, this cohort remains relatively less prepared than the energy exporters to manage the immediate aftermath of the crisis, as its calculus demands raw liquidity and energy sovereignty.
Conflict-Affected States: The Insolvent Periphery
Yemen, Sudan, Syria, and Lebanon form a grouping defined not by their capacity to absorb shocks, but by their prior exhaustion of such capacity. Each has experienced compounding conflict, eroding all key preparedness metrics even before the current crisis began.
Reserve positions illustrate the extent of this erosion. Yemen’s reserves stood at US$1.25 billion (2022); Sudan’s at US$177.9 million, with 2017 the last reliable data point—reflecting severe state dysfunction. Syria’s reserves, reported at US$20.6 billion in 2010, are estimated at US$200 million by end-2024.[12] Yemen scores −1.74 on the ECI (135th globally) and Sudan −2.13 (138th), the lowest in the sample. Sudan’s debt-to-GDP of 271.98 percent and Lebanon’s 164.1 percent are also the worst in the sample.
Lebanon merits distinction. Its ECI of 0.39 (54th globally) and reserves of US$33.3 billion reflect a historically sophisticated economy that is now regressing rapidly. The country has been engulfed in war since October 2023, with the new bout of hostilities costing it billions more in infrastructure.[13] The World Bank estimated that cumulative real GDP contraction since 2019 exceeded 38 percent by end-2024, with the 2024 conflict inflicting a further 6.6 percent decline.[14] Between 2019 and 2021, output shrank 58.1 percent, the steepest contraction across 193 countries.[15]
Similar patterns are evident elsewhere, Sudan’s real GDP fell by 37.5 percent in 2023.[16] Syria’s GDP in 2024 cumulatively contracted by over 50 percent since 2010. Claims that the state has attracted US$28 billion in foreign investments over a 10-month period are unlikely to turn the tide, not least as most of these deals are non-binding memoranda of understanding with no enforceable legal frameworks.[17] Similarly, Yemen also experienced a 54 percent decline in real GDP per capita between 2015 and 2023.[18] Therefore, these states are not experiencing a new economic decline in 2026, they are in fact facing a compounding of an existent economic crisis due to the regional conflict.
Conclusion
The 2026 conflict does not impose the same degree of stress across the MENA region. Algeria and Libya (and, to a lesser extent, Iraq) enter this crisis shielded by hydrocarbon revenues and substantial reserves, which, in the case of the two North African nations, stand to take a boost. Nonconflict- affected, middle-income importers occupy a contested middle ground, with resilience largely contingent on policy agility. Yemen, Sudan, Syria, and Lebanon face yet another shock exacerbating underlying fragilities: their reserve positions are exhausted, their debt burdens are massive, their productive bases have been hollowed by conflict, and their states can provide no safety net to their citizens.
To be sure, preparedness is not a regional condition, it is a state-specific calculus of fiscal buffers, liquidity, energy exposure, and structural adaptability. In a region marred with fragile states, the economic deterioration imposed by the conflict could erode the region’s economic standing in a volatile global economy. In all likelihood, its impact will serve as a stark reminder of how a structural lack of reform can deepen strategic heteronomy. Windfalls and financial pressure alike could lead to more aggressive behaviour at the state or intra-state levels, increasing risks of collision and unrest. Sharpened economic asymmetries across the Arab region could thus lead to further strategic challenges in an already fraught geopolitical scene.
Samriddhi Vij and Akram Zaoui are Associate Fellows, Geopolitics, ORF Middle East.
Endnotes
[16] Neil Quilliam and Kristian Alexander, “Iran and Gaza Conflicts Teach Gulf States a Hard-power Lesson,” Chatham House, March 16, 2026, https:// www.chathamhouse.org/publications/the-worldtoday/ 2026-03/iran-and-gaza-conflicts-teach-gulf-stateshard- power-lesson.
[17] Albert Vidal Ribe, “Defending the Skies of the Arab Gulf States,” IISS, March 18, 2026, https://www.iiss.org/onlineanalysis/ online-analysis/2026/03/defending-the-skies-ofthe- arab-gulf-states/.
[18] Maryna Lishchuk, “Saudi Arabia Bought Billions of Dollars Worth of Weapons from Russia,” European Foundation for Democracy, January 25, 2025, https://www. europeandemocracy.eu/news/saudi-arabia-boughtbillions- of-dollars-worth-of-weapons-from-russia/.
[19] Hana Elshehaby, “Gulf Security Beyond Guarantees,” Middle East Council on Global Affairs, April 5, 2026, https://mecouncil.org/blog_posts/gulf-security-beyondguarantees/.
[20] Huda Ata, “UAE to Reassess Global Ties after Iran Aggression, Gargash Says,” Gulf News, April 10, 2026, https://gulfnews.com/uae/uae-to-reassess-global-tiesafter- iran-aggression-gargash-says-1.500502435.
2. The Economic Implications of the Middle East Crisis: Measuring Preparedness in the MENA
[1] World Bank Group, “Classification of Fragile and Conflict-Affected Situations,” Brief, World Bank, 2024.
[2] International Monetary Fund, World Economic Outlook. Global Economy in the Shadow of War, April 2026, https:// www.imf.org/en/publications/weo/issues/2026/04/14/ world-economic-outlook-april-2026.
[3] International Monetary Fund, Regional Economic Outlook. Middle East and Central Asia. War in the Middle East: Spillovers and Policy Challenges, April 2026, https://www.imf. org/en/publications/reo/meca/issues/2026/04/16/regionaleconomic- outlook-middle-east-central-asia-april-2026.
[4] The figures are synthesis from different datasets; see Growth Lab, “Rankings,” The Atlas of Economic Complexity, Harvard Kennedy School, 2024, https:// atlas.hks.harvard.edu/rankings; World Bank, “Total Reserves (Includes Gold, Current US$),” 2024, https:// data.worldbank.org/indicator/FI.RES.TOTL.CD; World Bank, “Energy Imports, net (% of energy use),” 2022, https://data.worldbank.org/indicator/EG.IMP.CONS. ZS?locations=TN-MA-LB-DZ-PS-LY-EG-SY-JO-SD-YEIQ; “General Government Gross Debt, Percent of GDP,” International Monetary Fund, 2026, https://www.imf. org/external/datamapper/GGXWDG_NGDP@WEO/ OEMDC/ADVEC/WEOWORLD; “General Government Net Lending/Borrowing. Percent of GDP,” International Monetary Fund, 2026, https://www.imf.org/external/ datamapper/GGXCNL_NGDP@WEO/OEMDC/ADVEC/ WEOWORLD. For general government gross debt and net borrowing, 2024 is the last year where data is available for a clear majority of studied countries, while 2022 is the last year where data was available for most countries for net energy imports as share of total use.
[5] World Bank, “Energy Imports, net (% of energy use)” .
[6] World Bank, “Total Reserves (Includes Gold, Current US$)”.
[7] Hashem Krayem, “The Pound in the Post-Assad Era: Currency Stabilization in Syria,” Project on Middle East Political Science (POMEPS), Georgetown University, 2025, https://pomeps.org/the-pound-in-the-post-assadera- currency-stabilization-in-syria.
[8] Growth Lab, “Rankings”.
[9] Valentina Pasquali, “Algeria and Libya See Gains from Iran Conflict but Time Is of Essence,” Arabian Gulf Business Insight (AGBI), April 2026, https://www.agbi.com/ analysis/oil-and-gas/2026/04/algeria-and-libya-see-gainsfrom- iran-conflict-but-time-is-of-essence/.
[10] Yesar Al-Maleki, “Iraq’s Oil Export Vulnerability Exposes the Cost of Unresolved Disputes,” Atlantic Council, April 2026, https://www.atlanticcouncil.org/blogs/menasource/ iraqs-oil-export-vulnerability-exposes-the-cost-ofunresolved- disputes/.
[11] “The Resource Curse: The Political and Economic Challenges of Natural Resource Wealth,” Natural Resource Governance Institute (NRGI), March 2015, https://resourcegovernance.org/sites/default/files/nrgi_ Resource-Curse.pdf.
[12] Krayem, “The Pound in the Post-Assad Era: Currency Stabilization in Syria”.
[13] Adam Hancock, AFP and Reuters, “Israel Continues Attacks on Lebanon Despite Extension of Ceasefire,” Al Jazeera, April 2026, https://www.aljazeera.com/ news/2026/4/24/israel-continues-attacks-on-lebanondespite- extension-of-ceasefire.
[14] “Lebanon’s Economic Contraction Deepens, Highlighting Critical Need for Reforms and Key Investments,” World Bank Press Release, December 2024, https:// www.worldbank.org/en/news/press-release/2024/12/10/ lebanon-s-economic-contraction-deepens-highlightingcritical- need-for-reforms-and-key-investments.
[15] “Lebanon’s Crisis: Great Denial in the Deliberate Depression,” World Bank Press Release, January 2022, https://www.worldbank.org/en/news/press-releas e/2022/01/24/lebanon-s-crisis-great-denial-in-thedeliberate- depression.
[16] African Development Bank Group, “Sudan Economic Outlook,” 2024, https://www.afdb.org/en/countries/eastafrica/ sudan/sudan-economic-outlook.
[17] “New World Bank Report Highlights Syria’s Economic Challenges and Recovery Prospects for 2025,” World Bank Press Release, 2025, https://www.worldbank.org/en/ news/press-release/2025/07/07/-new-world-bank-reporthighlights- syria-s-economic-challenges-and-recoveryprospects- for-2025; Samriddhi Vij, “Syria’s Economy Remains on Life Support – a Recovery is Not in Sight,” Middle East Institute, National University of Singapore, 2026, https://mei.nus.edu.sg/think_in/syrias-economyremains- on-life-support-a-recovery-is-not-in-sight/.
[18] “Yemen’s Economy Faces Mounting Crises: Report,” World Bank Press Release, December 2024, https://www. worldbank.org/en/news/press-release/2024/06/26/yemens- economy-faces-mounting-crises-report.
3. The US-Iran Ceasefire Illusion: Energy Shortages Far from Over
1 Nicole Jao, “Oil Retreats After Hitting Four-year High on Concern of US-Iran War Escalation,” Reuters, April 30, 2026, https://www.reuters.com/business/energy/oilretreats- after-hitting-four-year-high-concern-us-iranwar- escalation-2026-04-30/.
2 “ICE Brent Crude Energy Future c1,” Reuters, May 6, 2026, https://www.reuters.com/markets/quote/LCOc1/.
3 IEA, “Key Facts on the Strait of Hormuz, Oil and Gas Markets, and the IEA’s Response,” https://www.iea.org/ topics/the-middle-east-and-global-energy-markets.