
Special Reports | 12 January, 2026 Download Report (PDF)
The Emerging ‘Hybrid Professional’: GenAI’s Impact on Skill Demand Changes in the UAE
Global models of Generative AI’s impact are insufficient for the United Arab Emirates, where national strategies collide with unique demographic pressures. This study addresses this gap through a novel, task-level analysis of 23,739 job postings, constructing a “Job Automatability Index” for the UAE. We find that AI exposure is invariant to geography, confirming its nature as a structural force. The results reveal sharp occupational polarisation: Clerical Support Workers face high substitution risks (53.8 percent automatability), while manual roles remain insulated. Critically, for the dominant professional class, AI’s primary mechanism is not substitution but the fundamental redefinition of core tasks. By identifying the emergence of the “hybrid professional,” this study provides a precise framework for policymakers to align Emiratisation, migration, and upskilling strategies with the mechanics of an AI-driven economy.
Attribution: Ahmed Dawoud and Ahmed Habashy, The Emerging 'Hybrid Professional': GenAI's Impact on Skill Demand Changes in the UAE, Observer Research Foundation, January 2026.
Introduction
The global economy is grappling with a profound paradox. While Generative Artificial Intelligence (GenAI) is being adopted at unprecedented speeds, its promise of a productivity revolution remains largely unfulfilled. This disconnect between individual efficiency gains and lagging organisational performance highlights a critical uncertainty: firms and nations are investing billions in a technology whose impact they do not yet fully understand. Global models offer broad predictions, but they are insufficient for navigating the high-stakes reality of a nation like the United Arab Emirates (UAE), where immense, state-driven AI ambition collides with unique economic and demographic pressures. The UAE’s national strategies for economic diversification and workforce nationalisation (what the UAE government refers to as “Emiratisation”) are being forged at the very moment AI is set to redefine the nature of work itself.
This challenge is particularly acute in a labour market where expatriate workers have historically dominated most sectors, particularly in low- and semi-skilled roles. The rationale of this analysis, therefore, stems from the urgent need to understand how AI can be leveraged to create high-value jobs for the national workforce of the UAE, aligning technological transformation with the strategic goals of Emiratisation.
This report confronts this uncertainty by moving beyond speculation to provide a high-resolution map of AI’s real-world impact on the UAE’s labour market. The challenge for policymakers and business leaders is not the absence of ambition, but a lack of granular, empirical evidence. It is one thing to know that AI will transform skills; it is another to know precisely which skills, in which jobs, and through what mechanism. Answering these questions is impossible with generic, top-down analyses that treat occupations as monolithic blocks.
This report introduces a novel, task-level methodology to analyse AI’s impact. By deconstructing over 23,000 online job postings into their constituent tasks, the authors’ proprietary analytical pipeline creates the Job Automatability Index—a bottom-up, data-driven measure of automation exposure. This approach allows one to pinpoint the true loci of change, revealing a sharp occupational polarisation hidden within broad sectoral trends. This report not only identifies the roles most exposed to substitution and those insulated from change, but, most importantly, it diagnoses the mechanics of augmentation and redefinition that will shape the future of high-skill professional work. It provides the first empirical baseline of AI’s impact on the UAE, offering actionable insights for navigating the complex interplay between technological disruption and national ambition.
Literature Review
GenAI is transforming the nature of work at an unprecedented speed and scale, raising urgent questions about its economic impact.[1] While global models provide a foundational understanding of this disruption, they are structurally ill-equipped to navigate the UAE’s distinct reality. Unlike the mature labour markets of the Global North, the UAE is defined by a severe demographic imbalance—where expatriates dominate the workforce—and a state-mandated urgency to integrate nationals into the private sector (‘Emiratisation’).
This creates a specific, high-stakes paradox: national strategies are pushing citizens toward administrative and white-collar roles that are now the primary targets of AI automation. Global models cannot account for this collision between workforce nationalisation and technological substitution. This review synthesises established research to pinpoint this critical gap, arguing that the UAE requires a bespoke empirical framework to ensure that AI becomes a tool for strategic economic leverage rather than a barrier to national ambition.
A New Technological Paradigm: Disruption of Speed and Scope
The current technological wave driven by GenAI is fundamentally distinct from previous shifts in its speed and scope.[2] Its adoption rate is unmatched: ChatGPT, for example, reached 100 million users in only two months—a milestone that took the internet seven years—dramatically reducing the adaptation timeline for workers, firms, and governments.[3]
Simultaneously, its scope extends beyond the routine administrative tasks disrupted by earlier technologies[4] to target core cognitive functions, like coding, design, and analysis, long considered the domain of high-skilled professionals.[5] Nearly 70 percent of occupations may now face substantial automation of their core functions,[6] confirming that GenAI is not merely another wave of automation but a paradigm shift targeting the core of the knowledge economy.
Skills-Based Transformation: The Four Occupational Archetypes
The most effective analysis of AI’s impact views occupations not as monolithic jobs to be eliminated but as dynamic bundles of tasks. This skill-first approach reveals that AI is a polarising force, sorting roles into four distinct archetypes: created, augmented, disrupted, and insulated.[7] Created occupations, such as AI engineering, are a small but rapidly growing segment of deep technical experts, with hiring growing 30 percent faster than the overall market in 2024.[8] Insulated roles, like nurses and construction specialists, are shielded by their reliance on physical dexterity and in-person interaction.
Critical transformations occur in the other two categories. Disrupted occupations, such as administrative assistants, are defined by a high concentration of automatable skills, creating an urgent need for skills-based career transitions. Augmented occupations represent the future of professional work. In roles like software engineering, AI automates routine components (e.g., code generation), freeing professionals to focus on higher-value human skills. Firms using AI code assistants, for instance, increased the hiring of software engineers but prioritised candidates with 13.3 percent more non-programming skills like project management.[9] This framework reframes the central question from job loss to skill evolution, highlighting a clear trend: the future belongs to those who can blend AI literacy with uniquely human skills.
Emerging Dynamics: Inequality and the Productivity Paradox
This skills transformation is not unfolding in a uniform manner. A consistent finding is that AI’s impact deepens gender inequality, as women, globally, are overrepresented in “disrupted” occupations while men are concentrated in “augmented” or “insulated” roles.[10] For instance, recent US-based data indicates that 79 percent of working women hold jobs susceptible to automation, compared to only 58 percent of men. This disparity is compounded by a persistent gender gap in the AI talent pipeline itself.[11]
Simultaneously, a “productivity paradox” has emerged, where surging individual efficiency is failing to translate into organisational profit. On one hand, AI adoption is exploding from the bottom up: three-quarters of knowledge workers now use AI to complete tasks faster and more effectively.[12] On the other hand, this surge in personal productivity is vanishing before it reaches the bottom line, with nearly 80 percent of businesses reporting no meaningful financial gains from their AI initiatives.[13]
This disconnect stems from a critical strategic failure: firms are using AI for tactical acceleration rather than fundamental reinvention. Making an employee faster at their existing job merely frees up their time; it does not automatically reconfigure that time into revenue-generating activities. True value is unlocked only through a deliberate, top-down strategy that overhauls entire workflows. However, these complex, high-impact projects are stalling, with an estimated 90 percent remaining stalled in the experimental phase, preventing the deep, systemic changes required to drive profit.
The Regional Imperative and the Identified Research Gap
Global frameworks are essential for identifying what is changing, but they cannot explain how and why it is changing in a specific socio-economic context like the UAE.[14]
This report, therefore, identifies a critical research gap: the absence of granular, empirical, real-time evidence tracking the evolution of skill demands within the high-stakes UAE market. Existing global models cannot capture the complex interplay of national policy, demographic pressures, and technological disruption. This study is designed to fill that void. By analysing thousands of online job postings, it will move beyond broad projections to provide concrete, data-driven evidence of the specific hybrid skill sets that UAE employers are demanding now. Such an analysis is not merely academic; it is an essential tool providing policymakers, educators, and business leaders with actionable insights to build a future-ready workforce in one of the world’s most dynamic economies.
Methodology
This study employs a novel, multi-stage methodology to measure the impact of AI by distilling job roles into their constituent tasks, creating a high-resolution measure of automation potential. The process comprises four key stages: (1) Data Collection and Pre-processing, (2) ISCO-08 Occupational Classification, (3) a proprietary AI-driven Task-Level Decomposition pipeline, and (4) construction of a weighted Job Automatability Index.
Data and Classification
The analysis is built on a dataset of 23,739 unique online job postings from the UAE’s leading public portals (LinkedIn, Bayt, and Dubizzle) during June-July 2025, representing an estimated 30 percent of the online market. As this data source predominantly captures medium- and high-skilled formal employment, low-skilled roles often filled through agencies are underrepresented. Therefore, the scope of this study is explicitly focused on quantifying the impact of AI on the formal, skilled labour market.
Rigorous pre-processing ensured data quality by removing duplicates, standardising names, and removing unstructured text. Each posting was then programmatically classified using the International Labour Organization’s (ILO) ISCO-08 taxonomy. This globally recognised framework enables the aggregation of granular findings into meaningful occupational groups, ensuring comparability with international labour market research.
AI-driven Task-Level Decomposition
To capture granular skill shifts, the authors developed a robust AI pipeline that deconstructs each job posting into its core tasks. The pipeline systematically executes a three-stage analysis using Gemini 2.5 Pro, with constrained decoding at each stage to guarantee structured, machine-readable JavaScript Object Notation (JSON) output.
- Task Extraction: The pipeline first configures the Large Language Model (LLM) as a specialised occupational analyst to extract a standardised list of one-15 tasks from each job description. A structured prompting framework required the model to ground every task directly in the source text, standardise outputs into a verb-object format (e.g., “analyse financial data”), and consolidate semantic redundancies.
- Importance Classification: Second, the model evaluates the relative importance of each extracted task, classifying it as Primary (core function), Secondary (significant but non-central), or Ancillary (supporting duty). This classification is performed on all of a job’s tasks simultaneously to ensure an accurate assessment of the role’s internal hierarchy.
- Automatability Assessment: In the final stage, the pipeline assesses each task’s automation potential against a rigorous analytical framework derived from established industry benchmarks and technical documentation. The framework defines clear features for Automatable Tasks (e.g., routine content generation, procedural workflows) and Not-Automatable tasks (e.g., strategic planning, empathetic interaction, physical capabilities). The model was required to justify each classification, creating a transparent and auditable analytical trail.
Job Automatability Index Construction
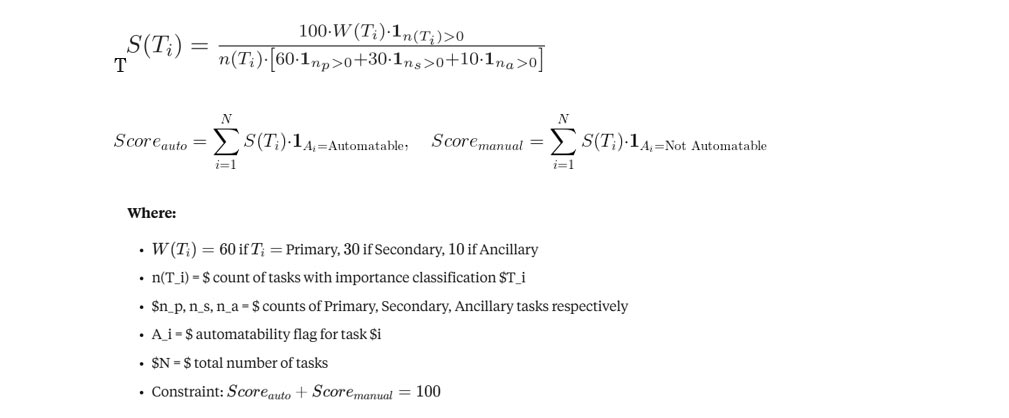
The task-level data were synthesised into a single metric: the Job Automatability Index. The index is a weighted proportion of a job’s responsibilities susceptible to automation. Primary tasks were assigned a 60 percent weight, secondary 30 percent, and ancillary 10 percent. A dynamic scaling mechanism normalises these weights to sum to 100 for every job, ensuring robust comparability across roles with varying numbers of tasks. The final index score is the sum of the scaled weights of all tasks classified as ‘Automatable’. Technical details can be found in Annex A.
Analytical Framework
The framework employs a tripartite standard to ensure findings are both statistically significant and practically meaningful. A subgroup’s deviation from the mean was deemed robustly significant only if it met three criteria:
- Practical Magnitude: An effect size of at least a small magnitude (|Cohen’s d| ≥ 0.2).
- Statistical Stability: A 95 percent confidence interval, constructed via a non-parametric percentile bootstrap (1,000 resamples), that does not contain zero.
- Statistical Significance: A p-value that remained significant (p_adj_ < 0.05) after adjusting for multiple comparisons using the Benjamini-Hochberg procedure.
This triangulation ensures that the conclusions are based on differences that are statistically improbable, stable, and of practical relevance. Technical details can be found in Annex A.
Methodological Rigour and Validation
To ensure the rigour and validity of the AI pipeline, the authors implemented a two-pronged strategy combining internal safeguards with external expert validation.
- Internally, constrained decoding to a JSON schema eliminated randomness, while a strict ‘grounding rule’ prevented model hallucination,[a] rendering the process replicable and auditable.
- Externally, a random sample of outputs was audited by three independent labour market experts. The model achieved over 90 percent concordance with expert consensus, with remaining discrepancies stemming primarily from subjective disagreements among the experts. This confirms that the model performs at a level comparable to human experts in this complex domain and functions as a high-speed analytical engine, not an opaque creative agent.
Profiling the UAE Labour Market
To properly contextualise the findings of the Job Automatability Index, this section first establishes an empirical profile of the UAE’s online labour market. The analysis examines the dataset’s scope and coverage, its geographic and occupational distribution, and prevailing work arrangements. This foundation provides the necessary real-world context for interpreting the subsequent automation analysis.
Data Coverage and Scope
The analysis is built on a dataset of 23,739 unique online job postings from June-July 2025, providing a comprehensive snapshot of the UAE labour market. The data encompasses 5,197 distinct companies across 36 economic sectors and includes postings from all seven emirates, ensuring a nationally representative sample.
Geographic Concentration
The UAE’s online labour market is highly concentrated, with job posts in Dubai (69.8 percent) and Abu Dhabi (23.8 percent). Together, these two emirates constitute over 93 percent of all job postings, confirming their role as the nation’s primary engines of employment (Table 1).
Table 1: Geographic Distribution of Online Job Postings Across UAE Emirates
| Emirate | Share (%) |
| Dubai | 69.8 |
| Abu Dhabi | 23.8 |
| Sharjah | 3.9 |
| Ras al-Khaimah | 1.2 |
| Ajman | 0.9 |
| Fujairah | 0.3 |
| Umm Al Qawain | 0.1 |
Source: Authors’ own with the online job postings dataset (n=23,739).
Occupational and Sectoral Profile of a Mature Knowledge Economy
The UAE labour market is defined by its demand for high-skilled expertise, a clear indicator of a mature knowledge economy. ‘Professionals’ (38.5 percent) and ‘Managers’ (29.1 percent) together constitute over two-thirds (67.6 percent) of all advertised roles. Demand within these categories is concentrated in strategic functions: ‘Business and Administration Professionals’ (15.7 percent), ‘Science and Engineering Professionals’ (8.5 percent), and various commercial and services managers (Tables 2 and B.1).
Table 2: Distribution of Online Job Postings by Major Occupational Category (ISCO-08 Level 1)
| Job Category (ISCO Level-1) | Share (%) |
| Professionals | 38.5 |
| Managers | 29.1 |
| Technicians and Associate Professionals | 13.7 |
| Service and Sales Workers | 7.2 |
| Clerical Support Workers | 5.8 |
| Craft and Related Trades Workers | 2.8 |
| Plant and Machine Operators, and Assemblers | 1.5 |
| Elementary Occupations | 1.4 |
| Agricultural, Forestry and Fishery Workers | 0.0 |
Source: Authors’ own, using online job postings dataset (n=23,739).
This occupational structure is driven by a sophisticated and diversified sectoral base. While anchored by large industries like IT & Technology (18.2 percent) and Hospitality (12.0 percent), the economy’s maturity is evident in its long tail of specialised, knowledge-intensive sectors, including Legal, Design, and Environmental Services. The collective demand from this diverse ecosystem sustains the market’s strong orientation toward high-calibre professional and managerial talent (Tables 3 & B.2).
Table 3: Top 10 Sectors by Share of Online Job Postings
| Sector | Share (%) |
| IT & Technology | 18.2 |
| Hospitality & Travel | 12.0 |
| Real Estate & Construction | 10.1 |
| Consulting & Professional Services | 7.5 |
| Human Resources & Staffing | 7.3 |
| Financial Services | 7.0 |
| Education | 5.6 |
| Retail | 4.9 |
| Manufacturing | 4.8 |
| Healthcare & Life Sciences | 3.9 |
Source: Authors’ own, using online job postings dataset (n=23,739).
Work Arrangements and Market Dynamics
Analysis of work arrangements and applicant data reveals a labour market that is simultaneously traditional, highly competitive, and demanding. The market is defined by a strong adherence to on-site work (89.7 percent), a stark contrast to post-pandemic global trends. This traditional structure coexists with intense competition, as 77.6 percent of all job listings attract more than 90 applicants. This dynamic is further complicated by a 26 percent job reposting rate, which suggests that despite a large applicant pool, employers face challenges in finding candidates with the precise qualifications they require. Together, these factors depict a highly selective environment where a surplus of applicants competes for specific, high-value roles (Tables 4, 5, 6).
Table 4: Distribution of Online Job Postings by Required Work Arrangement
| Work Arrangement | Share (%) |
| On-site | 89.7 |
| Remote | 5.7 |
| Hybrid | 4.6 |
Source: Authors’ own, using online job postings dataset (n=23,739).
Table 5: Distribution of Online Job Postings by Applicant Volume
| Number of Applicants | Share (%) |
| 0 – 30 | 7.8 |
| 30 – 60 | 8.5 |
| 60 – 90 | 6.2 |
| 90 – 120 | 77.6 |
Source: Authors’ own, using online job postings dataset (n=23,739).
Table 6: Distribution of Online Job Postings by Reposting Status
| Reposted? | Share (%) |
| Not-Reposted | 74 |
| Reposted | 26 |
Source: Authors’ own, using online job postings dataset (n=23,739).
Summary of Key Findings
This descriptive analysis profiles the UAE’s online job market as a landscape of concentrated opportunity. It is geographically centred in Dubai and Abu Dhabi and structurally dominated by demand for high-skilled Professionals and Managers. This demand is fuelled by a sophisticated economic base, combining dominant sectors like Technology and Hospitality with a long tail of specialised, knowledge-intensive industries. Operationally, the market remains traditional, with a strong preference for on-site work, and is exceptionally competitive, with a high volume of applicants for most roles.
This profile is derived from a substantial dataset of over 23,000 postings, estimated to represent 30 percent of the total online market. While not a complete census, this robust sample provides a data-driven and directionally accurate snapshot of the dominant forces shaping the UAE’s skill demand.
This empirical foundation provides the critical context for the core analysis of this report: determining the susceptibility of this economic structure to transformation by Generative AI.
The Impact of AI on the UAE Labour Market
This section assesses the susceptibility of the UAE labour market to automation driven by Generative AI. By applying the Job Automatability Index to a dataset of over 23,000 online job postings, it establishes a quantitative baseline for the potential impact of AI on high-skill occupations. The analysis will first explore the overall degree of task automatability across the market, considering the broad implications for future skill demands and productivity. Subsequently, the chapter moves beyond this aggregate view to investigate the significant heterogeneity present within the labour force. This granular approach is essential for identifying the specific sectors and job roles most exposed to technological disruption, as well as those that remain relatively insulated, providing a more detailed forecast of the forthcoming structural shifts.
A Question of Role, Not Place: The Irrelevance of Geography and Work Mode
The analysis reveals a notable invariance in AI automation exposure regarding both geography and work arrangement. Mean Automatability Index scores are statistically indistinguishable between roles in Dubai (29.57) and Abu Dhabi (27.29) and similarly aligned between on-site (28.67) and remote (25.83) positions (Tables 7, 8). Although minor variances occasionally register weak statistical significance (p < 0.10), their negligible effect sizes confirm that these differences are sampling artefacts rather than systemic trends.
This invariance leads to a critical conclusion: AI’s transformative potential is a function of a role’s intrinsic tasks, not its circumstantial context. For example, a Data Analyst in Abu Dhabi faces the same high level of AI exposure as one in Dubai because the core tasks of their roles—such as data entry, analysis, and report generation—are fundamentally the same and highly susceptible to automation. The impact of Generative AI is therefore best understood as a fundamental, task-based shift—not a regional phenomenon or a byproduct of work policy. This finding necessitates the deeper occupational and sectoral analysis provided in the following sections.
Table 7: Automatability Index / Emirates
| Emirate | Mean | N | Cohen’s d | p-value | Sig. | Effect |
| Fujairah | 31.78 | 53 | 0.124 | 0.6126 | Negligible | |
| Not Specified | 25.69 | 2672 | -0.109 | 0.0000 | * | Negligible |
| Sharjah | 26.26 | 833 | -0.087 | 0.0272 | * | Negligible |
| Abu Dhabi | 27.29 | 5037 | -0.048 | 0.0011 | * | Negligible |
| Dubai | 29.57 | 14699 | 0.040 | 0.0000 | * | Negligible |
| Umm Al Qawain | 29.28 | 25 | 0.029 | 0.9376 | Negligible | |
| Ras al-Khaimah | 29.24 | 247 | 0.027 | 0.8952 | Negligible | |
| Ajman | 28.72 | 173 | 0.007 | 0.9376 | Negligible | |
| Dataset Average | 28.53 | 23739 | 0.000 | Reference |
Source: Authors’ own with the online job postings dataset (n=23,739).
Note* p < 0.05 or meaningful effect with robust CI.
Cohen’s d: Standardised effect size (0.2=small, 0.5=medium, 0.8=large).
p-values adjusted for multiple comparisons using FDR correction.
Table 8: Automatability Index / Work Type
| Work Type | Mean | N | Cohen’s d | p-value | Sig. | Effect |
| Remote | 25.83 | 902 | -0.103 | 0.0091 | * | Negligible |
| Hybrid | 26.86 | 731 | -0.064 | 0.1395 | Negligible | |
| Not Specified | 28.74 | 7868 | 0.008 | 0.5247 | Negligible | |
| On-site | 28.67 | 14238 | 0.005 | 0.5247 | Reference | |
| Dataset Average | 28.53 | 23739 | 0.000 | Reference |
Source: Authors’ own with the online job postings dataset (n=23,739).
Note* p < 0.05 or meaningful effect with robust CI.
Cohen’s d: Standardised effect size (0.2=small, 0.5=medium, 0.8=large).
p-values adjusted for multiple comparisons using FDR correction.
Sectoral Fault Lines: Where the Transformation Hits Hardest
Sectoral analysis reveals a market defined by broad-based exposure rather than isolated pockets of risk. While headline averages range from 40.83 (Investment & Venture Capital) to 8.3 (Creative Services), the vast majority of sectors do not deviate meaningfully from the market average, registering only “Negligible” or “Small” effect sizes (Table 9). The sole exception is the Wellness & Fitness sector (10.8), whose “Medium” and “Significant” effect sizes confirm a unique concentration of roles insulated by physical and interpersonal tasks.
This widespread exposure confirms that GenAI is a cross-cutting technological wave, whose impact is determined by occupation, not industry. Sectors as diverse as Real Estate (34.09) and Financial Services (29.14) have similar exposure levels, revealing that a sector is merely a heterogeneous collection of roles. The high score for Investment & Venture Capital, for instance, stems not from the automation of investing itself, but from its concentration of analysts and researchers whose data-synthesis and report-generation tasks are highly susceptible to automation. Therefore, while sectoral data confirms AI’s pervasive reach, it is an insufficient lens. A granular, occupation-level analysis is required to identify the true epicentres of change, a task the following section undertakes.
Table 9: Automatability Index / Sector
| Sector | Mean | N | Cohen’s d | p-value | Sig. | Effect |
| Creative Services | 8.33 | 3 | -0.775 | 0.0890 | * | Medium |
| Wellness & Fitness | 10.81 | 167 | -0.680 | 0.0000 | *** | Medium |
| Investment & Venture Capital | 40.83 | 170 | 0.471 | 0.0000 | *** | Medium |
| Executive Offices | 38.93 | 31 | 0.399 | 0.0473 | * | Small |
| Holding Companies | 37.89 | 86 | 0.359 | 0.0043 | *** | Small |
| Healthcare & Life Sciences | 19.22 | 507 | -0.359 | 0.0000 | *** | Small |
| Education | 19.93 | 738 | -0.331 | 0.0000 | *** | Small |
| Environmental Services | 37.06 | 55 | 0.327 | 0.0378 | ** | Small |
| Design Services | 36.76 | 58 | 0.315 | 0.0378 | ** | Small |
| Consumer Services | 20.80 | 35 | -0.297 | 0.0915 | * | Small |
| Legal Services | 34.71 | 24 | 0.237 | 0.4760 | Small | |
| Retail | 34.60 | 646 | 0.233 | 0.0000 | *** | Small |
| Real Estate & Construction | 34.09 | 1328 | 0.214 | 0.0000 | *** | Small |
| Government & Public Sector | 33.78 | 193 | 0.201 | 0.0118 | ** | Small |
| Wholesale & Distribution | 33.75 | 14 | 0.200 | 0.7023 | Small | |
| Media & Communications | 24.12 | 208 | -0.169 | 0.0266 | * | Negligible |
| Events Services | 32.91 | 55 | 0.168 | 0.2748 | Negligible | |
| Automotive | 32.50 | 7 | 0.152 | 0.8227 | Negligible | |
| Agriculture | 32.44 | 7 | 0.150 | 0.8227 | Negligible | |
| Aerospace & Defence | 32.39 | 11 | 0.148 | 0.7185 | Negligible | |
| Manufacturing | 32.25 | 629 | 0.143 | 0.0010 | * | Negligible |
| Hospitality & Travel | 24.94 | 1572 | -0.138 | 0.0000 | * | Negligible |
| Food & Beverage | 31.87 | 130 | 0.128 | 0.2522 | Negligible | |
| Professional Organizations | 25.56 | 6 | -0.114 | 0.8844 | Negligible | |
| Consulting & Professional Services | 31.02 | 979 | 0.095 | 0.0105 | * | Negligible |
| Facilities Services | 30.47 | 68 | 0.074 | 0.7899 | Negligible | |
| Human Resources & Staffing | 26.61 | 962 | -0.074 | 0.0450 | * | Negligible |
| Security Services | 29.74 | 43 | 0.046 | 0.8227 | Negligible | |
| IT & Technology | 27.46 | 2385 | -0.041 | 0.0642 | Negligible | |
| Energy & Utilities | 29.57 | 375 | 0.040 | 0.5856 | Negligible | |
| Entertainment | 29.29 | 138 | 0.029 | 0.8227 | Negligible | |
| Advertising & Marketing | 29.16 | 156 | 0.024 | 0.8357 | Negligible | |
| Financial Services | 29.14 | 912 | 0.024 | 0.6462 | Negligible | |
| Transportation & Logistics | 28.35 | 335 | -0.007 | 0.9131 | Negligible | |
| Unspecified | 28.71 | 10650 | 0.007 | 0.7023 | Negligible | |
| Non-Profit & Social Services | 28.67 | 55 | 0.005 | 0.9678 | Negligible | |
| Research | 0.00 | 1 | ||||
| Dataset Average | 28.53 | 23739 | 0.000 | Reference |
Source: Authors’ own with the online job postings dataset (n=23,739).
Note* p < 0.05 or meaningful effect with robust CI.
Cohen’s d: Standardised effect size (0.2=small, 0.5=medium, 0.8=large).
p-values adjusted for multiple comparisons using FDR correction.
Occupational Polarisation: The True Locus of AI’s Impact
Shifting from sectoral to occupational analysis reveals the true contours of AI’s impact: not widespread, uniform exposure, but sharp polarisation. The data cleaves the labour market into distinct groups based on the nature of their core tasks, with routine cognitive work being the most vulnerable.
The Highly Exposed: Routine Cognitive Work
This vulnerability is most pronounced among Clerical Support Workers, who are a clear outlier with an average Automatability Index of 53.84 and a “Large” effect size (Cohen’s d = 0.960). Their extreme exposure stems from a role composition defined by structured, information-based tasks—data entry, scheduling, document management—that are highly susceptible to automation. This alignment is so direct that specific roles like General/Keyboard Clerks reach an automation potential of 73.00 (Tables 10, 11).
Accounting for 6 percent of total employment, this high susceptibility signals massive, near-term labour market disruption. This dynamic points not to occupational elimination but to a productivity paradigm shift: fewer AI-augmented workers will manage a substantially larger volume of tasks. Such a shift will likely create transitional employment pressures that persist until reskilling and adaptation—whether through individual or policy-led initiatives—can be achieved.
Table 10: Automatability Index / Occupation (ISCO-08 Level 1)
| Occupation (ISCO-08, Level 1) | Mean | N | Cohen’s d | p-value | Sig. | Effect |
| Clerical Support Workers | 53.84 | 1373 | 0.960 | 0.0000 | *** | Large |
| Elementary Occupations | 7.55 | 327 | -0.809 | 0.0000 | *** | Large |
| Craft and Related Trades Workers | 12.38 | 660 | -0.626 | 0.0000 | *** | Medium |
| Plant and Machine Operators, and Assemblers | 12.75 | 360 | -0.608 | 0.0000 | *** | Medium |
| Technicians and Associate Professionals | 39.39 | 3260 | 0.408 | 0.0000 | *** | Small |
| Service and Sales Workers | 20.31 | 1701 | -0.318 | 0.0000 | *** | Small |
| Skilled Agricultural, Forestry and Fishery Workers | 21.62 | 8 | -0.265 | 0.2149 | Small | |
| Managers | 22.81 | 6910 | -0.232 | 0.0000 | *** | Small |
| Professionals | 29.25 | 9140 | 0.028 | 0.0096 | * | Negligible |
| Dataset Average | 28.53 | 23739 | 0.000 | Reference |
Source: Authors’ own with the online job postings dataset (n=23,739).
* p < 0.05 or meaningful effect with robust CI.
Cohen’s d: Standardized effect size (0.2=small, 0.5=medium, 0.8=large).
p-values adjusted for multiple comparisons using FDR correction.
The Highly Insulated: Manual and Physical Work
At the opposite pole, occupations grounded in physical labour are the most insulated from GenAI. Elementary Occupations (7.55) and Craft Workers (12.38) exhibit the lowest automatability scores, their resilience rooted in tasks requiring dexterity and mobility in unpredictable environments (e.g., Manual Labourers, 7.11). This insulation is specific to cognitive AI; the long-term threat from robotics unfolds over a slower, capital-intensive, multi-decade horizon. This provides a longer time for adaptation. Furthermore, roles like Personal Care Workers (9.42) blend physical tasks with empathy, a quality exceptionally difficult to automate, creating an even more durable barrier.
The Arena of Augmentation: Professionals and Managers
The most critical finding, however, concerns the UAE’s dominant high-skill occupations, where AI’s primary role will be augmentation, not replacement. The unremarkable scores for Professionals (29.25) and Managers (22.81) mask a decisive internal heterogeneity. For example, low-exposure roles like Teaching Professionals (10.87) contrast sharply with high-exposure Business and Administration Professionals (36.04) (Table 11). This variance demonstrates that AI is poised to automate the routine cognitive components of knowledge work—data analysis and reporting—thereby amplifying the value of strategic, creative, and interpersonal skills that machines cannot fully replicate, at least as of this research.
Table 11: Automatability Index / Occupation (ISCO-08 Level 2)
| Occupation (ISCO-08, Level 2) | Mean | N | Cohen’s d | p-value | Sig. | Effect |
| General/Keyboard Clerks | 73.00 | 305 | 1.704 | 0.0000 | *** | Large |
| Other Clerical Workers | 67.41 | 59 | 1.491 | 0.0000 | *** | Large |
| Recording Clerks | 55.41 | 178 | 1.029 | 0.0000 | *** | Large |
| Manual Labourers | 7.11 | 97 | -0.823 | 0.0000 | *** | Large |
| Cleaners/Helpers | 7.15 | 162 | -0.822 | 0.0000 | *** | Large |
| Food Prep Assistants | 7.24 | 49 | -0.817 | 0.0000 | *** | Large |
| Building Trades (excl. Elec.) | 9.03 | 179 | -0.750 | 0.0000 | *** | Medium |
| Bus/Admin Assoc. Prof. | 47.95 | 1828 | 0.736 | 0.0000 | *** | Medium |
| Personal Care Workers | 9.42 | 69 | -0.734 | 0.0000 | *** | Medium |
| Drivers/Operators | 9.57 | 279 | -0.730 | 0.0000 | *** | Medium |
| Teaching Professionals | 10.87 | 884 | -0.686 | 0.0000 | *** | Medium |
| Health Professionals | 11.72 | 819 | -0.653 | 0.0000 | *** | Medium |
| Customer Service Clerks | 45.51 | 831 | 0.649 | 0.0000 | *** | Medium |
| Metal/Machinery Trades | 11.90 | 231 | -0.640 | 0.0000 | *** | Medium |
| Executives/Officials | 13.93 | 184 | -0.561 | 0.0000 | *** | Medium |
| Refuse/Elementary Workers | 14.80 | 18 | -0.527 | 0.0419 | ** | Medium |
| Electrical Trades | 14.88 | 154 | -0.525 | 0.0000 | *** | Medium |
| Personal Service Workers | 15.18 | 912 | -0.517 | 0.0000 | *** | Medium |
| Handicraft/Printing Workers | 15.42 | 10 | -0.503 | 0.1206 | Medium | |
| Food/Wood/Craft Trades | 15.78 | 86 | -0.490 | 0.0000 | *** | Small |
| Health Assoc. Professionals | 16.17 | 233 | -0.475 | 0.0000 | *** | Small |
| Protective Services | 18.29 | 82 | -0.393 | 0.0000 | *** | Small |
| Agricultural Workers | 20.14 | 7 | -0.322 | 0.1951 | Small | |
| Production Managers | 20.85 | 2768 | -0.303 | 0.0000 | *** | Small |
| Bus./Admin Professionals | 36.04 | 3733 | 0.288 | 0.0000 | *** | Small |
| ICT Technicians | 36.02 | 203 | 0.287 | 0.0003 | *** | Small |
| Legal/Social Assoc. Prof. | 21.80 | 308 | -0.258 | 0.0000 | *** | Small |
| Hospitality/Retail Mgrs | 22.76 | 847 | -0.223 | 0.0000 | *** | Small |
| Assemblers | 23.10 | 12 | -0.208 | 0.2792 | Small | |
| Sci/Eng Assoc. Prof. | 33.41 | 688 | 0.187 | 0.0000 | * | Negligible |
| Plant/Machine Operators | 23.78 | 69 | -0.182 | 0.0833 | Negligible | |
| Sci/Eng Professionals | 33.03 | 2009 | 0.172 | 0.0000 | *** | Negligible |
| Admin/Commercial Mgrs | 25.10 | 3111 | -0.135 | 0.0000 | *** | Negligible |
| Legal/Social Professionals | 30.77 | 380 | 0.086 | 0.1358 | Negligible | |
| ICT Professionals | 27.05 | 1315 | -0.057 | 0.0399 | * | Negligible |
| Sales Workers | 29.09 | 638 | 0.021 | 0.5686 | Negligible | |
| Forestry/Fishery Workers | 32.00 | 1 | ||||
| Not Found | 0.00 | 1 | ||||
| Dataset Average | 28.53 | 23739 | 0.000 | Reference |
Source: Authors’ own with the online job postings dataset (n=23,739).
Note* p < 0.05 or meaningful effect with robust CI.
Cohen’s d: Standardised effect size (0.2=small, 0.5=medium, 0.8=large).
p-values adjusted for multiple comparisons using FDR correction.
Core vs. Periphery: The Mechanics of Occupational Transformation
The occupational polarisation previously identified is not random; it is governed by a precise mechanism. The nature of AI’s impact—whether it substitutes, augments, or redefines a role—depends entirely on which tasks it automates: a job’s core value-creating functions or its peripheral administrative duties. Analysing the task-level data through this lens reveals three distinct archetypes of transformation.
Substitution: When AI Automates the Core
The most disruptive transformation occurs when AI targets an occupation’s “vulnerable core.” This dynamic defines clerical roles, where primary, value-creating tasks like data entry and document management are highly automatable—reaching 73.5 percent for General/Keyboard Clerks. Here, AI is not an auxiliary tool but a direct substitute for the role’s fundamental purpose. The logical outcome is not total job extinction but structural consolidation: fewer workers, augmented by AI, will absorb a vastly larger workload, creating substantial and near-term displacement pressure.
Augmentation: When AI Automates the Periphery
Augmentation is a far more common scenario, which occurs when AI targets peripheral tasks while leaving a “safe core” intact. Hospitality/Retail Managers exemplify this archetype. Their core functions of strategy and interpersonal leadership are highly insulated (13.8 percent primary automation), yet nearly 36 percent of their secondary administrative duties are not. In this model, AI functions as a powerful productivity engine, automating routine burdens to liberate professionals. This allows them to dedicate their full attention to the high-value, uniquely human activities that drive success, from mentorship to strategic innovation.
Redefinition: When AI Transforms the Core Itself
Redefinition is the most profound and consequential transformation, which targets the UAE’s dominant knowledge-worker occupations. For roles like Business and Scientific Professionals, AI automates a substantial portion of both primary (31.0 percent) and secondary (42.6 percent) tasks. This dual pressure does not simply augment the role; it fundamentally redefines its core purpose. An engineer’s value shifts from performing complex calculations to directing an AI that models thousands of scenarios. A business analyst’s expertise shifts from generating reports to interrogating AI-synthesised data for strategic insights.
Table 12: Automatability Index (Primary, Secondary, Ancillary) / Occupation (ISCO-08 Level 2)
| Occupation (ISCO-08, Level 2) | N | Primary | Secondary | Ancillary | Dominant Impact |
| Admin/Commercial Mgrs | 3111 | 18.1 | 35.3 | 24.2 | Mixed |
| Assemblers | 12 | 12.6 | 43.9 | 21.1 | Augmented |
| Building Trades (excl. Elec.) | 179 | 4.1 | 16.1 | 13.5 | Insulated |
| Bus./Admin Assoc. Prof. | 1828 | 43.3 | 54.8 | 29.3 | Disrupted |
| Bus./Admin Professionals | 3733 | 31.0 | 42.6 | 29.7 | Mixed |
| Executives/Officials | 184 | 9.2 | 19.8 | 13.4 | Insulated |
| Cleaners/Helpers | 162 | 1.4 | 14.0 | 19.7 | Insulated |
| Customer Service Clerks | 831 | 43.5 | 49.9 | 24.1 | Disrupted |
| Drivers/Operators | 279 | 3.5 | 19.4 | 12.8 | Insulated |
| Electrical Trades | 154 | 7.1 | 25.1 | 28.7 | Insulated |
| Food Prep Assistants | 49 | 2.4 | 14.2 | 14.2 | Insulated |
| Food/Wood/Craft Trades | 86 | 11.4 | 22.9 | 10.0 | Insulated |
| General/Keyboard Clerks | 305 | 73.5 | 63.6 | 30.5 | Disrupted |
| Handicraft/Printing Workers | 10 | 10.0 | 22.3 | 20.0 | Insulated |
| Health Assoc. Professionals | 233 | 12.7 | 21.0 | 16.5 | Insulated |
| Health Professionals | 819 | 4.8 | 19.3 | 24.7 | Insulated |
| Hospitality/Retail Mgrs | 847 | 13.8 | 35.8 | 26.8 | Augmented |
| ICT Technicians | 203 | 32.0 | 41.9 | 27.5 | Disrupted |
| ICT Professionals | 1315 | 23.8 | 30.3 | 23.2 | Insulated |
| Manual Labourers | 97 | 6.0 | 8.3 | 4.0 | Insulated |
| Legal/Social Professionals | 380 | 28.0 | 31.6 | 23.6 | Mixed |
| Legal/Social Assoc. Prof. | 308 | 17.1 | 28.4 | 18.3 | Insulated |
| Agricultural Workers | 7 | 5.7 | 46.2 | 21.4 | Augmented |
| Metal/Machinery Trades | 231 | 5.3 | 23.1 | 16.4 | Insulated |
| Recording Clerks | 178 | 58.4 | 50.2 | 21.8 | Disrupted |
| Other Clerical Workers | 59 | 69.8 | 60.8 | 18.9 | Disrupted |
| Personal Care Workers | 69 | 3.9 | 19.5 | 10.0 | Insulated |
| Personal Service Workers | 912 | 10.8 | 22.0 | 15.9 | Insulated |
| Production Managers | 2768 | 14.6 | 29.7 | 21.6 | Mixed |
| Protective Services | 82 | 8.5 | 35.5 | 11.9 | Insulated |
| Refuse/Elementary Workers | 18 | 6.3 | 23.2 | 14.4 | Insulated |
| Sales Workers | 638 | 21.8 | 37.4 | 26.5 | Mixed |
| Sci/Eng Assoc. Prof. | 688 | 29.3 | 38.7 | 24.6 | Mixed |
| Sci/Eng Professionals | 2009 | 31.1 | 33.4 | 24.8 | Mixed |
| Plant/Machine Operators | 69 | 20.0 | 29.4 | 21.8 | Mixed |
| Teaching Professionals | 884 | 7.1 | 16.3 | 14.2 | Insulated |
Source: Authors’ own with the online job postings dataset (n=23,739).
This dynamic forges the “hybrid professional,” whose value is no longer measured by their ability to execute cognitive tasks, but by their skill in orchestrating them. For this critical segment of the workforce, deep domain expertise must fuse with AI literacy. Mastering this new paradigm of AI-assisted professional work is not an option—it is the new definition of competence.
Discussion and Implications
The findings of this study move beyond a simple quantification of automation to reveal the precise mechanics of a transformation that is already underway. Crucially, the analysis demonstrates that the UAE’s labour market is not merely facing a shift in efficiency, but a fundamental re-architecture of how value is created across the economy. This core insight leads to a series of strategic implications for policymakers, educators, and business leaders as they navigate the transition to an AI-driven economy.
Principal Findings: A New Framework for Understanding Transformation
This analysis produced three principal findings that, when taken together, form a cohesive narrative of change.
- The Invariance of Impact: First, it is established that within the UAE’s formal skilled labour market, AI exposure is fundamentally a function of a role’s tasks, not its geography or work mode. This invariance confirms that AI is a structural, cross-cutting force that cannot be mitigated by regional policy or specific work arrangements.
- The Polarisation of Occupations: Second, the analysis reveals that the true fault lines of disruption are occupational, not sectoral. The labour market is cleaving into three distinct groups: a highly exposed cohort of Clerical Support Workers facing substitution; a highly insulated group of Manual and Physical Workers shielded by the current limits of AI and robotics; and the largest and most critical group, Professionals and Managers, who are entering an era of augmentation and redefinition.
- The Mechanics of Change: Finally, the argument moves beyond identifying who is affected to explain how. By analysing the automation of core versus peripheral tasks, three distinct mechanisms can be identified: substitution for roles with a vulnerable core (e.g., Clerical), productivity enhancement for roles with a safe core (e.g., Hospitality Managers), and profound redefinition for the knowledge workers whose core tasks are themselves being transformed (e.g., Business & Engineering Professionals).
Strategic Implications for Policy and Practice
These findings are not merely descriptive; they form a strategic map for action. The challenge for the UAE is not to halt automation, but to manage its consequences and harness its potential to accelerate national economic and human capital goals.
A Portfolio Approach to Reskilling for Human Capital and Education
A one-size-fits-all approach to AI upskilling is destined to fail. The evidence calls for a targeted, portfolio-based national skills strategy:
- Reskilling for the Disrupted: The high exposure of Clerical Support Workers (53.84 percent automation) signals a near-term risk of transitional unemployment. Policy should focus on urgent reskilling initiatives that create pathways from these roles into adjacent, more insulated occupations (e.g., from administrative support to event coordination or personal services).
- Upskilling for the Augmented: For the majority of the professional workforce, the challenge is not replacement but redefinition. Higher education and corporate training must pivot from teaching discrete, automatable skills (e.g., basic data analysis, report writing) to cultivating the durable human skills that AI amplifies. Curricula should prioritise strategic thinking, complex problem-solving, creativity, and—most critically—the executive function of directing and validating AI systems. This is the new definition of professional competence.
A Strategic Opportunity for Migration, Expatriate Policy, and Emiratisation
The polarisation of AI’s impact presents a unique strategic opportunity to reshape the labour market in alignment with national priorities.
- Automation as a Policy Lever: The roles most susceptible to automation, both clerical (substitution) and manual (long-term robotics), are predominantly held by the expatriate workforce. This allows automation to serve as a de facto policy lever, reducing reliance on expatriate labour for routine tasks without causing widespread disruption to the national workforce.
- Strategic Workforce Calibration:The polarisation of risk offers a dual opportunity. For Emiratisation, it mandates a pivot away from placing citizens in vulnerable administrative roles and toward the high value ‘hybrid’ positions of the future. Simultaneously, it addresses the heavy reliance on expatriate labour in routine service sectors. As AI automates these “heavy-lifting” tasks, the UAE can effectively decouple economic growth from low-skilled labour importation, shifting its migration policy to prioritise the specialised, high-technical talent required to maintain an AI-driven economy.
Solving the Productivity Paradox for National Economic Strategy
The findings affirm that the primary barrier to realising the economic potential of AI is not the technology itself, but its superficial implementation. The government and industry leaders can play a crucial role in overcoming this paradox by:
- Incentivising Deep Integration: Policy can shift from promoting AI adoption in general to incentivising deep, systemic integration. This could include grants, tax credits, or support programmes for projects that use AI to reinvent entire business processes, not just accelerate old ones.
- Fostering a Pro-Innovation Environment: Addressing the intense competition in the job market requires not just more jobs, but better ones. By fostering an environment where firms can translate AI-driven productivity into growth, innovation, and the creation of new high-value roles, the UAE can ensure that the benefits of automation are broadly shared.
Scope for Future Research
Future research should pursue longitudinal studies to track skill demand changes over time, broaden data sources to include non-digital job markets, and conduct firm-level case studies to qualitatively explore how the process of “role redefinition” is being managed in practice.
Annex A
A.1. Job Automatability Index Formulation
The Job Automatability Index is a weighted score (0-100) representing the proportion of a job’s responsibilities susceptible to automation. The score is constructed by first calculating a normalised weight for each task and then summing the weights of all automatable tasks.
A.2. Effect Size Calculation (Cohen’s d)
To quantify the practical magnitude of the difference between a subgroup’s mean score and the total population’s mean score, Cohen’s d is calculated using the pooled standard deviation.
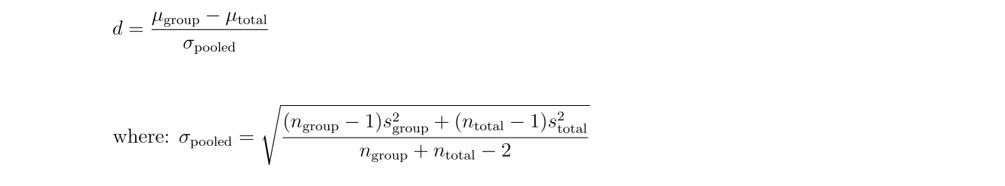
Where:
- μ_group and μ_total are the mean Automatability Index scores for the subgroup and the total sample, respectively.
- n_group and n_total are the number of observations (jobs) in the subgroup and the total sample.
- s_group^2 and s_total^2 are the variances of the scores for the subgroup and the total sample.
A.3 Benjamini-Hochberg (B-H) Procedure
The Benjamini-Hochberg (B-H) procedure controls the False Discovery Rate (FDR) by identifying the largest rank k for which the following condition holds:

Where:
- p_(k) is the k-th p-value when all m p-values are ranked in ascending order
- m is the total number of hypothesis tests conducted
- Q is the chosen False Discovery Rate (e.g., 0.05)
Annex B
Table B.1: Detailed Occupational Distribution of Online Job Postings by Sub-Major Group (ISCO-08 Level 2)
| Row Labels | Percent |
| Professionals | 38.5 |
| Business and Administration Professionals | 15.7 |
| Science and Engineering Professionals | 8.5 |
| Information and Communications Technology Professionals | 5.5 |
| Teaching Professionals | 3.7 |
| Health Professionals | 3.5 |
| Legal, Social and Cultural Professionals | 1.6 |
| Managers | 29.1 |
| Administrative and Commercial Managers | 13.1 |
| Production and Specialized Services Managers | 11.7 |
| Hospitality, Retail and Other Services Managers | 3.6 |
| Chief Executives, Senior Officials and Legislators | 0.8 |
| Technicians and Associate Professionals | 13.7 |
| Business and Administration Associate Professionals | 7.7 |
| Science and Engineering Associate Professionals | 2.9 |
| Legal, Social, Cultural and Related Associate Professionals | 1.3 |
| Health Associate Professionals | 1.0 |
| Information and Communications Technicians | 0.9 |
| Service and Sales Workers | 7.2 |
| Personal Service Workers | 3.8 |
| Sales Workers | 2.7 |
| Protective Services Workers | 0.3 |
| Personal Care Workers | 0.3 |
| Clerical Support Workers | 5.8 |
| Customer Services Clerks | 3.5 |
| General and Keyboard Clerks | 1.3 |
| Numerical and Material Recording Clerks | 0.7 |
| Other Clerical Support Workers | 0.2 |
| Craft and Related Trades Workers | 2.8 |
| Metal, Machinery and Related Trades Workers | 1.0 |
| Building and Related Trades Workers (excluding Electricians) | 0.8 |
| Electrical and Electronics Trades Workers | 0.6 |
| Food Processing, Woodworking, Garment and Other Craft and Related Trades Workers | 0.4 |
| Handicraft and Printing Workers | 0.0 |
| Plant and Machine Operators, and Assemblers | 1.5 |
| Drivers and Mobile Plant Operators | 1.2 |
| Stationary Plant and Machine Operators | 0.3 |
| Assemblers | 0.1 |
| Elementary Occupations | 1.4 |
| Cleaners and Helpers | 0.7 |
| Labourers in Mining, Construction, Manufacturing and Transport | 0.4 |
| Food Preparation Assistants | 0.2 |
| Refuse Workers and Other Elementary Workers | 0.1 |
| Not Found | 0.0 |
| Skilled Agricultural, Forestry and Fishery Workers | 0.0 |
| Market-oriented Skilled Agricultural Workers | 0.0 |
| Market-Oriented Skilled Forestry, Fishery and Hunting Workers | 0.0 |
| Grand Total | 100.0 |
Source: Authors’ own with the online job postings dataset (n=23,739).
Table B.2: Complete Sectoral Distribution of Online Job Postings.
| Row Labels | Sum of count (in %) |
| IT & Technology | 18.2 |
| Hospitality & Travel | 12.0 |
| Real Estate & Construction | 10.1 |
| Consulting & Professional Services | 7.5 |
| Human Resources & Staffing | 7.3 |
| Financial Services | 7.0 |
| Education | 5.6 |
| Retail | 4.9 |
| Manufacturing | 4.8 |
| Healthcare & Life Sciences | 3.9 |
| Energy & Utilities | 2.9 |
| Transportation & Logistics | 2.6 |
| Media & Communications | 1.6 |
| Government & Public Sector | 1.5 |
| Investment & Venture Capital | 1.3 |
| Wellness & Fitness | 1.3 |
| Advertising & Marketing | 1.2 |
| Entertainment | 1.1 |
| Food & Beverage | 1.0 |
| Holding Companies | 0.7 |
| Facilities Services | 0.5 |
| Design Services | 0.4 |
| Events Services | 0.4 |
| Environmental Services | 0.4 |
| Non-Profit & Social Services | 0.4 |
| Security Services | 0.3 |
| Consumer Services | 0.3 |
| Executive Offices | 0.2 |
| Legal Services | 0.2 |
| Wholesale & Distribution | 0.1 |
| Aerospace & Defense | 0.1 |
| Agriculture | 0.1 |
| Automotive | 0.1 |
| Professional Organizations | 0.0 |
| Creative Services | 0.0 |
| Research | 0.0 |
| Grand Total | 100.00 |
Source: Authors’ own with the online job postings dataset (n=23,739).
Ahmed Dawoud is Economist and Head of Data Science, The Egyptian Center for Economic Studies.
Ahmed Habashy is AI Engineer, The Egyptian Center for Economic Studies (ECES).
All views expressed in this publication are solely those of the authors, and do not represent the Observer Research Foundation, either in its entirety or its officials and personnel.
Endnotes
[a] Large Language Models (LLMs) are inherently stochastic, meaning they often generate different outputs for the same input. Constrained decoding mitigates this by forcing the model to select the most probable output within a fixed structure, ensuring that if the analysis is repeated, the results remain identical.
[1] McKinsey & Company, “The Economic Potential of Generative AI: The Next Productivity Frontier,” June 14, 2023; Microsoft and LinkedIn, “2024 Work Trend Index Annual Report: AI at Work Is Here. Now Comes the Hard Part,” 2024.
[2] Tyna Eloundou et al., “GPTs are GPTs: Labor Market Impact Potential of LLMs,” Science 384, no. 6702 (2024): 1306-1308.
[3] Hao Zhang, “The Future of Work: AI’s Impact on Employment and Social Structures in the Digital Age,” in Proceedings of the 2nd International Conference on Management Research and Economic Development (2024).
[4] Daron Acemoglu and David Autor, “Skills, Tasks and Technologies: Implications for Employment and Earnings,” in Handbook of Labor Economics (Elsevier (North-Holland), 2011), pp. 1043–1171.
[5] Edward Felten, Manav Raj, and Robert Seamans, “How will Language Modelers like ChatGPT Affect Occupations and Industries?,” SSRN, March 1, 2023, https://papers.ssrn.com/sol3/papers.cfm?abstract_id=4375268.
[6] Aria Zarifhonarvar, “Economics of ChatGPT: A Labor Market View on the Occupational Impact of Artificial Intelligence,” Journal of Electronic Business & Digital Economics 3, no. 2 (2023): 100-116.
[7] Karin Kimbrough and Moreno Carpanelli, “Preparing the Workforce for Generative AI: Insights and Implications,” LinkedIn Economic Graph Research Institute, August 23, 2023; Moreno Carpanelli, M. Baird, and C. Jara-Figueroa, “Generative AI’s Influence on Employment Patterns,” LinkedIn Economic Graph, June 2024.
[8] Access Partnership, AI and the Global Economy: Unlocking Growth and Reshaping Work, 2024.
[9] M. Baird et al., “Early Evidence on the Impact of GitHub Copilot on Labor Market Outcomes for Software Engineers,” Working Paper No. #5, LinkedIn Economic Graph Research Institute, September 2024.
[10] M. Baird, M. Carpanelli, and S. Lara, “Generative AI and Gender: Global Measures of Workers in GAI Classifications,” LinkedIn Economic Graph, March 6, 2024; World Economic Forum and LinkedIn, “Gender Parity in the Intelligent Age,” White Paper, March 2025; Kimbrough and Carpanelli, “Preparing the Workforce for Generative AI.”
[11] OECD, “The AI Workforce: What LinkedIn Data Reveals About ‘AI Talent’ Trends in OECD Countries,” OECD.AI Policy Observatory, May 22, 2025.
[12] Microsoft and LinkedIn, “2024 Work Trend Index Annual Report”; Fabrizio Dell’Acqua et al., “Navigating the Jagged Technological Frontier: Field Experimental Evidence of the Effects of AI on Knowledge Worker Productivity and Quality,” Harvard Business School Technology & Operations Mgt. Unit Working Paper No. 24-013, 2023.
[13] McKinsey & Company, “Seizing the Agentic AI Advantage: A CEO Playbook to Solve the Gen AI Paradox and Unlock Scalable Impact with AI Agents,” QuantumBlack, AI by McKinsey, June 2025.
[14] T. Isherwood and V. Chandran, “The State of Gen AI in the Middle East’s GCC Countries: A 2024 Report Card,” McKinsey & Company, 2024.